Copyright
©2008 The WJG Press and Baishideng.
World J Gastroenterol. Feb 28, 2008; 14(8): 1237-1243
Published online Feb 28, 2008. doi: 10.3748/wjg.14.1237
Published online Feb 28, 2008. doi: 10.3748/wjg.14.1237
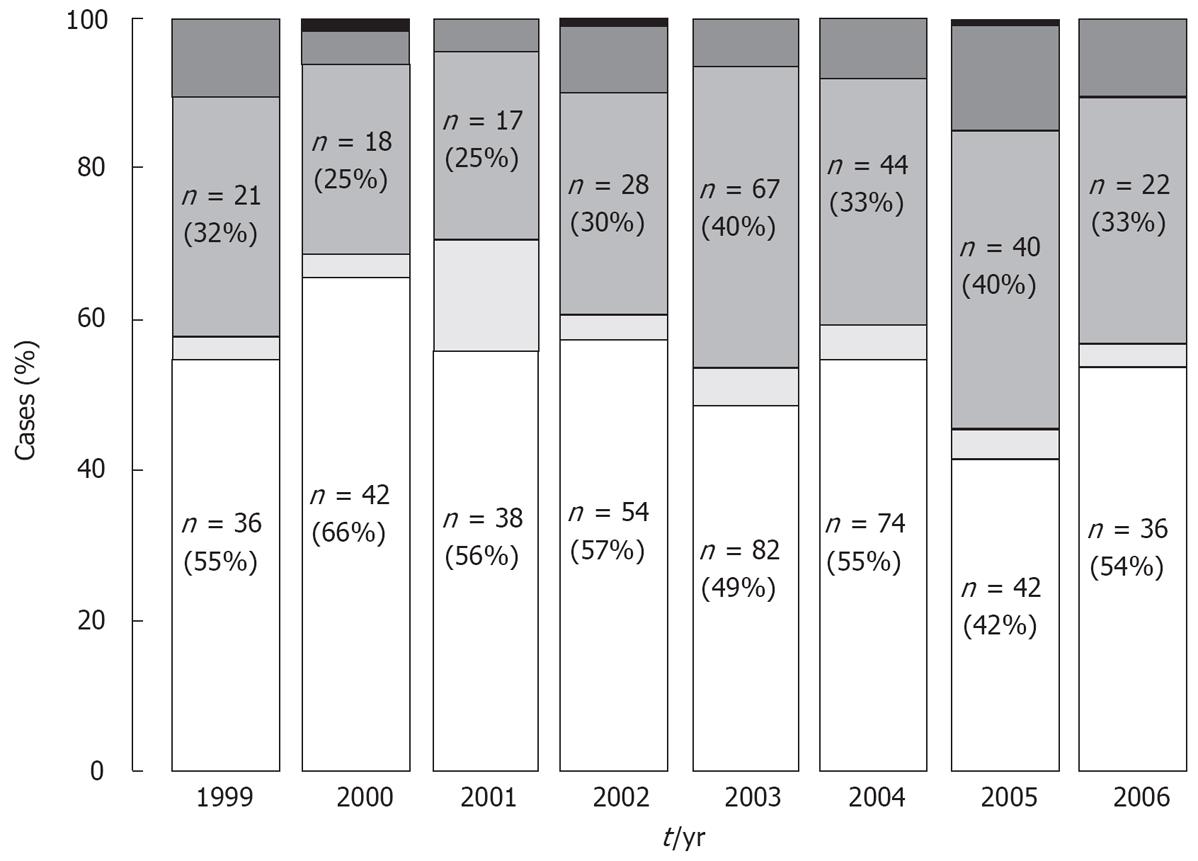
Figure 1 HCV genotype incidence from 1999 to 2006.
The genotypes are indicated in the bars by different shades of grey, representing from bottom to top, genotypes 1, 2, 3, 4 and 5. Number of cases and percentages are mentioned for genotype 1 and 3. No significant changes in genotype distribution over time have been observed during this 7 years period.
Figure 2 Distribution of HCV genotypes.
A: Distribution of HCV genotypes in patients according to gender. Genotype 3 is more frequent in male (P < 0.0001), genotype 2 and genotype 5 are more frequent in female (P = 0.047 and P = 0.0027 respectively); B: Distribution of HCV genotypes in patients according to age. Genotype 3 is associated to patients < 40 yr (P < 0.0001). Genotype 2 is associated to patients > 40 yr (P = 0.0064).
- Citation: Roman F, Hawotte K, Struck D, Ternes AM, Servais JY, Arendt V, Hoffman P, Hemmer R, Staub T, Seguin-Devaux C, Schmit JC. Hepatitis C virus genotypes distribution and transmission risk factors in Luxembourg from 1991 to 2006. World J Gastroenterol 2008; 14(8): 1237-1243
- URL: https://www.wjgnet.com/1007-9327/full/v14/i8/1237.htm
- DOI: https://dx.doi.org/10.3748/wjg.14.1237


