Copyright
©2008 The WJG Press and Baishideng.
World J Gastroenterol. Feb 28, 2008; 14(8): 1204-1211
Published online Feb 28, 2008. doi: 10.3748/wjg.14.1204
Published online Feb 28, 2008. doi: 10.3748/wjg.14.1204
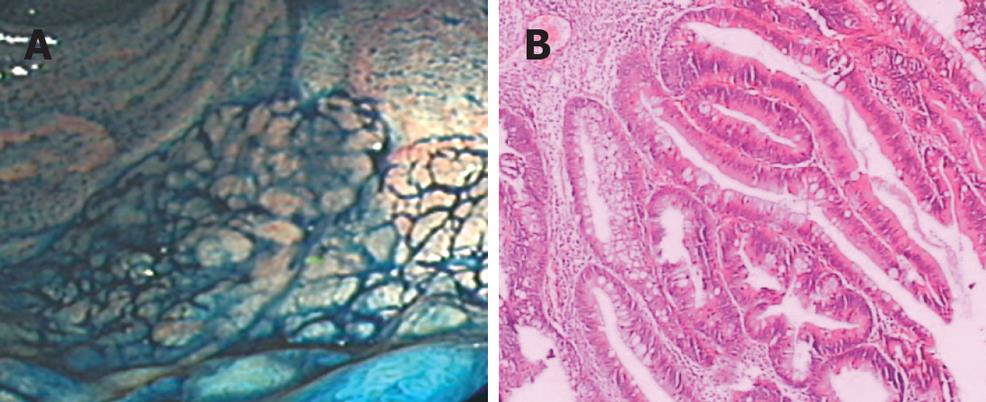
Figure 1 Endoscope and the histopathology of LST.
A: LST under endoscope which grows laterally in the rectum, 3 cm far from the anus and has a diameter of 60 mm × 70 mm; B: The histopathology of the tissue: a villous adenoma accompanied by moderate severe atypical hyperplasia.
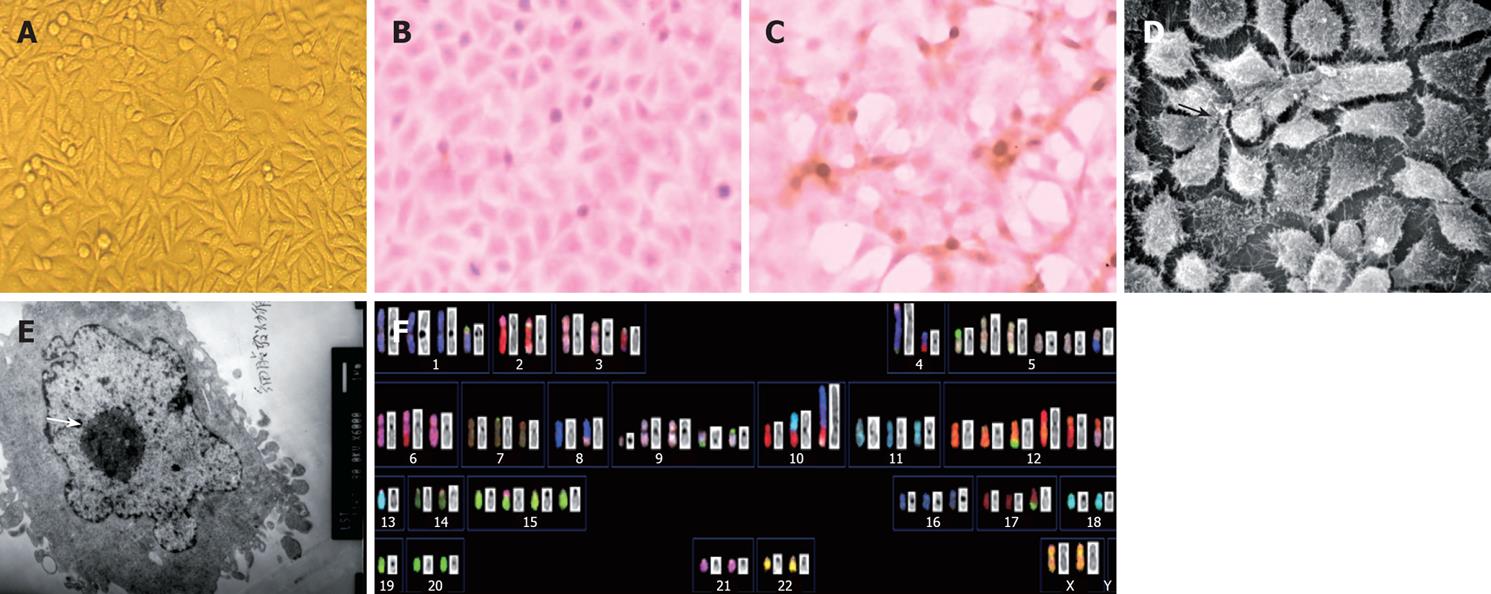
Figure 2 Origin and morphology of LST-R1.
A: The morphology of cultured cells under microscope at passage 5. The cells are polymorphic and the percentage of epithelial cells is more than 90% (× 10); B, C: Immunostaining for the epithelial markers ESA and CK20 in LST-R1 cells at passage 5. Cells were grown on chamber slides and stained for ESA (B) and CK20 (C) expression with a specific antibody; D: Under scanning electron microscope (× 1000), dense microvilli and tight junction were observed. Arrow indicates tight junction; E: cell observed under transmission electron microscope (× 6000). Arrow indicates nucleus; F: Representative karyotype of LST-R1 cell line. Aberrations were observed in the majority of LST-R1 cells. The karyotypic description is listed in Table 1.
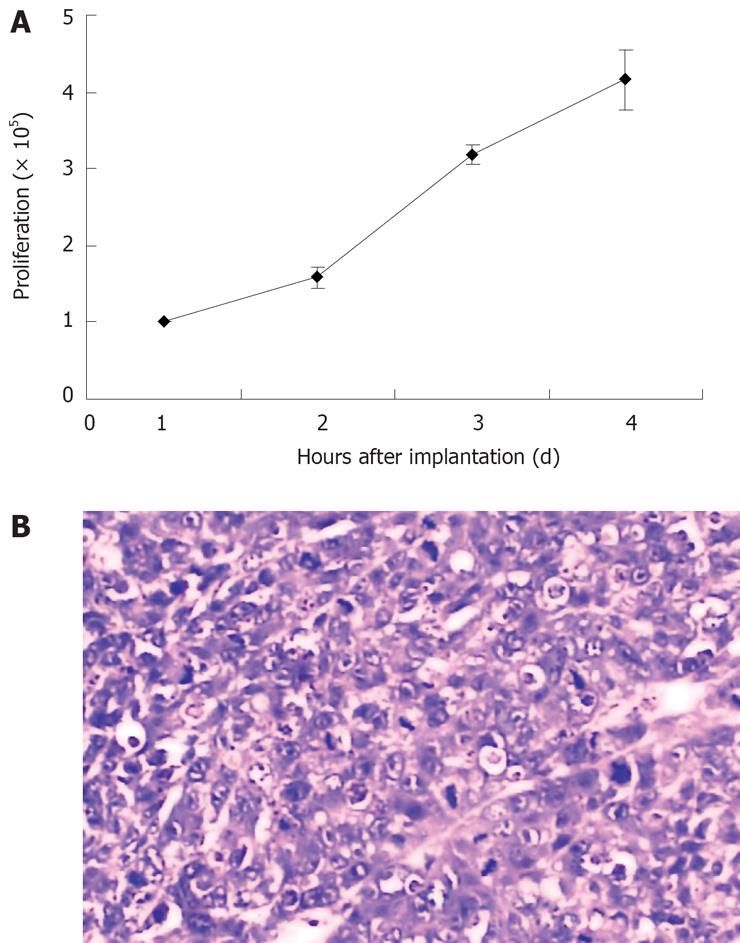
Figure 3 The growth properties of LST-R1 in vitro and in vivo.
A: The growth curve of LSR-R1 cell line. Data points are the means of three independent experiments; B: Tumorigenicity in vivo. The nude mice were sacrificed when the tumor reached 60 mm × 40 mm in size. The histopathology shows a poor differentiated adenocarcinoma.
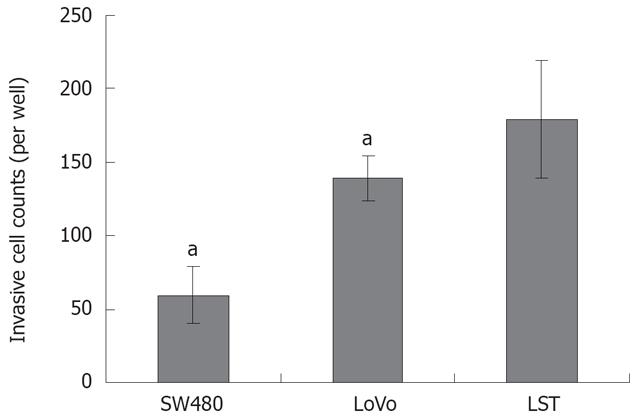
Figure 4 The invasion abilities of various cancer cell lines.
The Matrigel invasion chamber was used to measure the LST cells invading through a matrix of reconstituted basement membrane compared to the other two cell lines SW480 and lovo. aP < 0.05, significant difference between LST and other two cell lines, paired t-test.
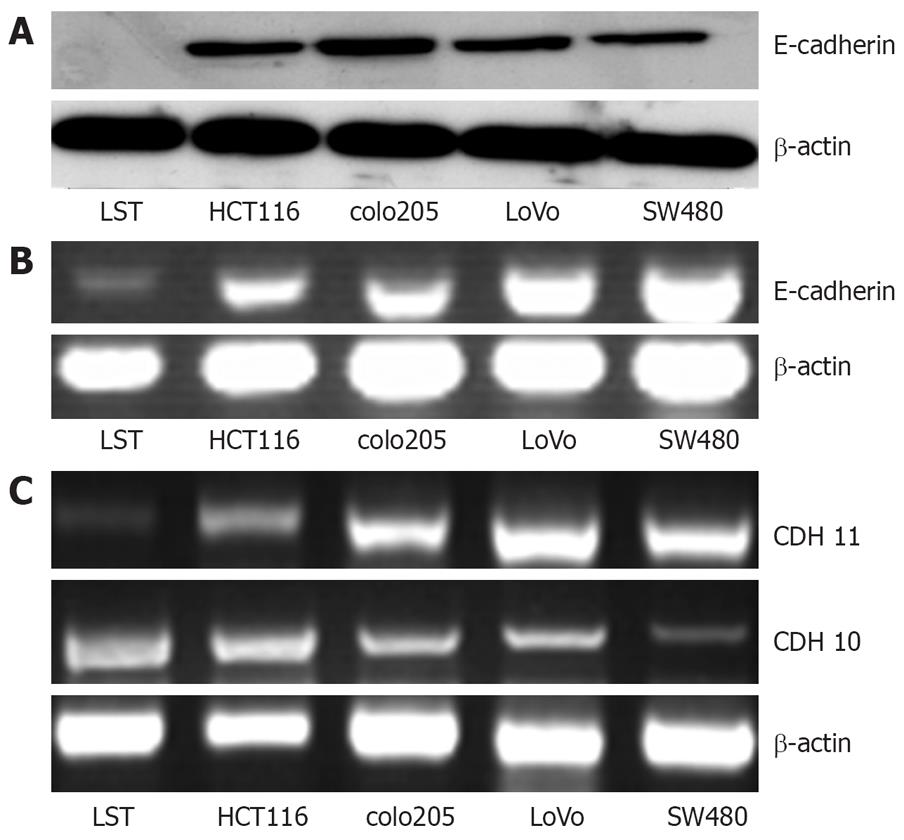
Figure 5 Detection of E-cadherin, CDH10 and CDH11 expression in various colorectal cancer cell lines by Western blotting analysis (A) and RT-PCR (B and C).
The experiment was repeated for three times with similar result as shown here.
- Citation: Wang XY, Lai ZS, Yeung CM, Wang JD, Deng W, Li HY, Han YJ, Kung HF, Jiang B, Lin MCM. Establishment and characterization of a new cell line derived from human colorectal laterally spreading tumor. World J Gastroenterol 2008; 14(8): 1204-1211
- URL: https://www.wjgnet.com/1007-9327/full/v14/i8/1204.htm
- DOI: https://dx.doi.org/10.3748/wjg.14.1204


