Copyright
©2008 The WJG Press and Baishideng.
World J Gastroenterol. Feb 21, 2008; 14(7): 1112-1119
Published online Feb 21, 2008. doi: 10.3748/wjg.14.1112
Published online Feb 21, 2008. doi: 10.3748/wjg.14.1112
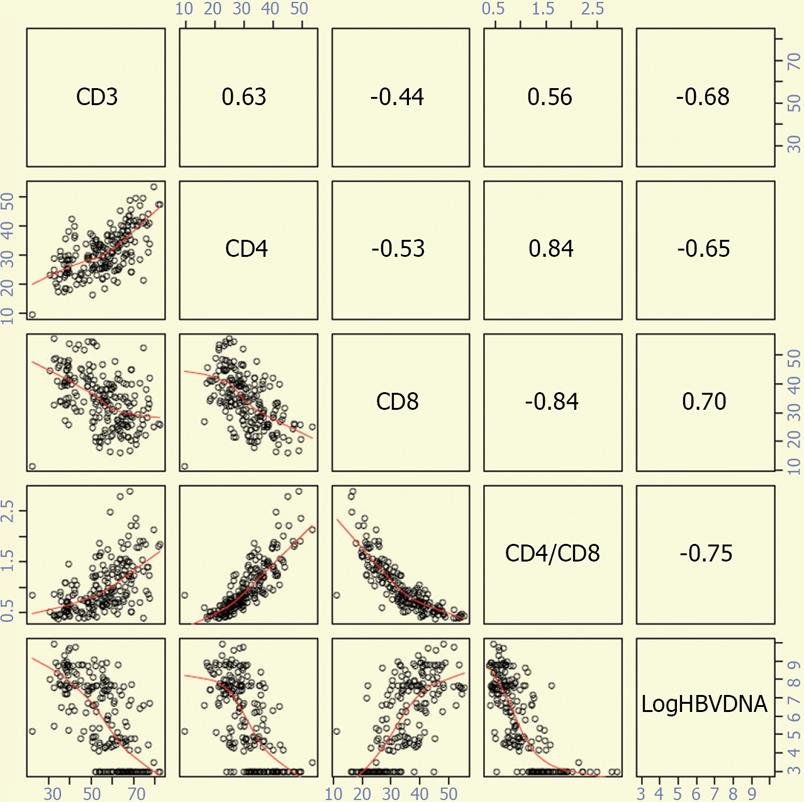
Figure 1 Correlation between peripheral T-cell subsets and serum level of HBV viral load.
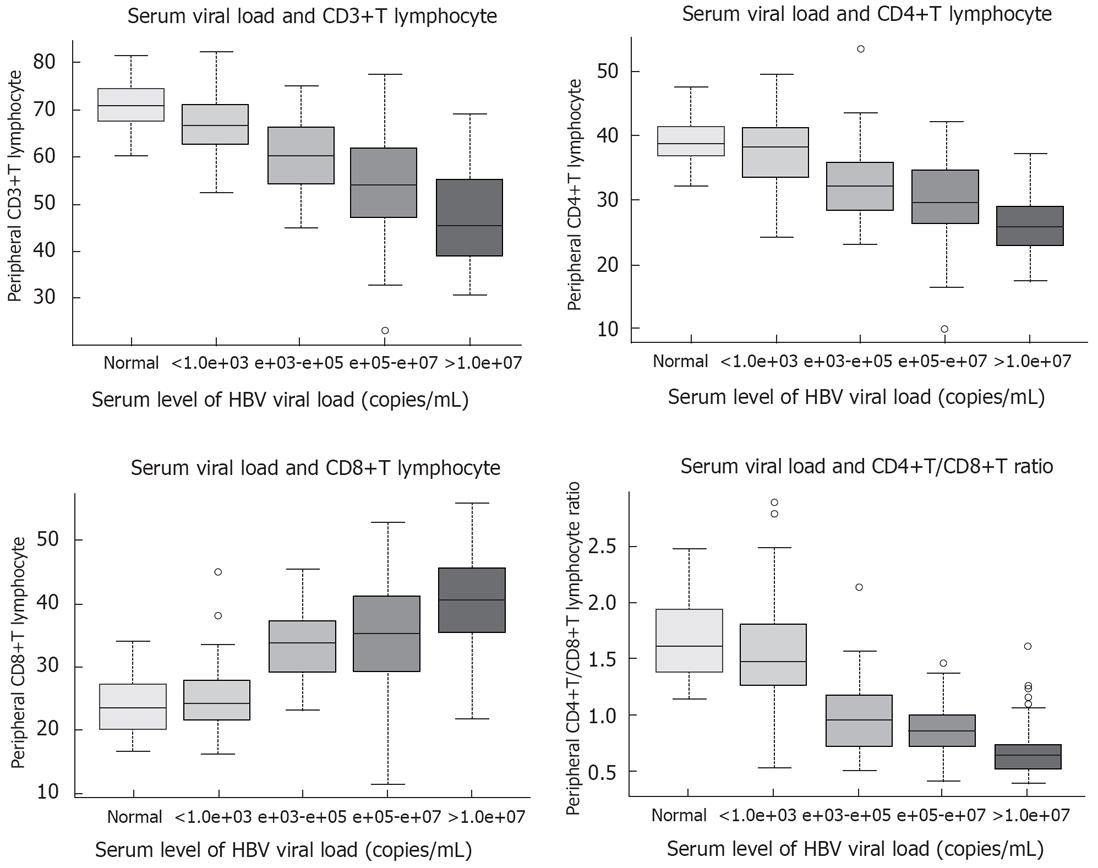
Figure 2 Peripheral T-lymphocyte subpopulations by serum HBV viral load level.
On the figure, the marks “<1.0e+03”, “e+03-e+05”, “e+05-e+07” and “>1.0e+07” denote “< 103”, “103-105”, “105-107” and “> 107”, respectively.
- Citation: You J, Sriplung H, Geater A, Chongsuvivatwong V, Zhuang L, Chen HY, Yu L, Tang BZ, Huang JH. Effect of viral load on T-lymphocyte failure in patients with chronic hepatitis B. World J Gastroenterol 2008; 14(7): 1112-1119
- URL: https://www.wjgnet.com/1007-9327/full/v14/i7/1112.htm
- DOI: https://dx.doi.org/10.3748/wjg.14.1112


