Copyright
©2008 The WJG Press and Baishideng.
World J Gastroenterol. Feb 21, 2008; 14(7): 1060-1066
Published online Feb 21, 2008. doi: 10.3748/wjg.14.1060
Published online Feb 21, 2008. doi: 10.3748/wjg.14.1060
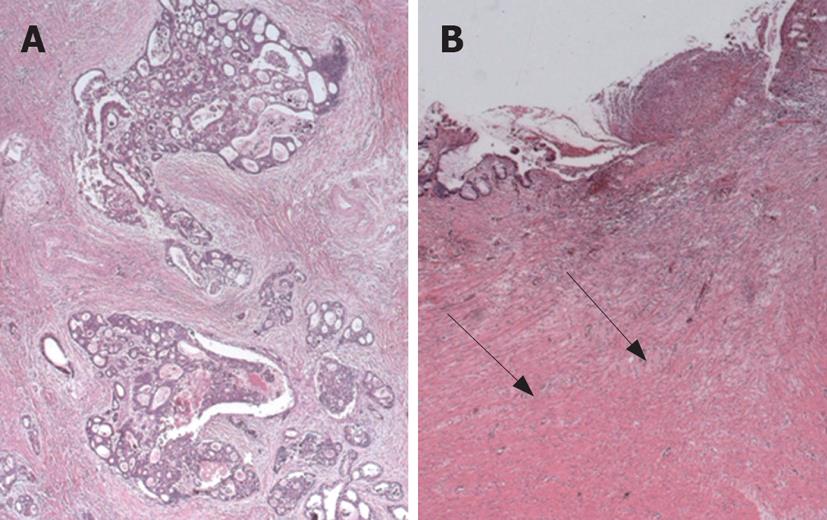
Figure 1 Rectal adenocarcinomas with different tumor regression grade (TRG) after preoperative chemoradiotherapy: dominant tumor with obvious fibrosis in a non-responder, TRG1 (A); dominant fibrosis with very few tumor cell groups in a responder, TRG3 (B).
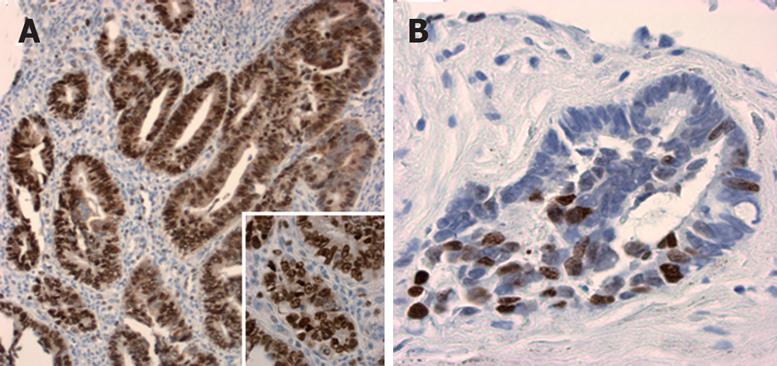
Figure 2 Ki67 expression in post-therapeutical resection specimens.
High proliferative index with more than 90% positive nuclei (magnification × 10; insert: × 40) (A), and low proliferative index with less than 40% positive nuclei (magnification × 20) (B).
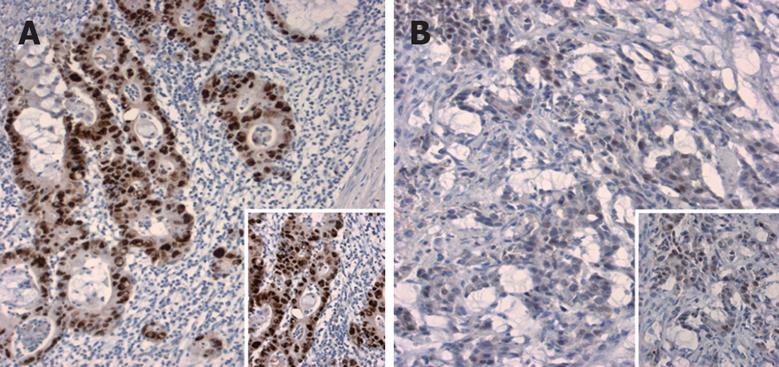
Figure 3 P53 expression in post-therapeutical resection specimens.
Overexpression of p53 with more than 75% (A) and about 25% positive nuclei (B) (magnification × 10; inserts × 20).
- Citation: Jakob C, Liersch T, Meyer W, Becker H, Baretton GB, Aust DE. Predictive value of Ki67 and p53 in locally advanced rectal cancer: Correlation with thymidylate synthase and histopathological tumor regression after neoadjuvant 5-FU-based chemoradiotherapy. World J Gastroenterol 2008; 14(7): 1060-1066
- URL: https://www.wjgnet.com/1007-9327/full/v14/i7/1060.htm
- DOI: https://dx.doi.org/10.3748/wjg.14.1060


