Copyright
©2008 The WJG Press and Baishideng.
World J Gastroenterol. Feb 21, 2008; 14(7): 1053-1059
Published online Feb 21, 2008. doi: 10.3748/wjg.14.1053
Published online Feb 21, 2008. doi: 10.3748/wjg.14.1053
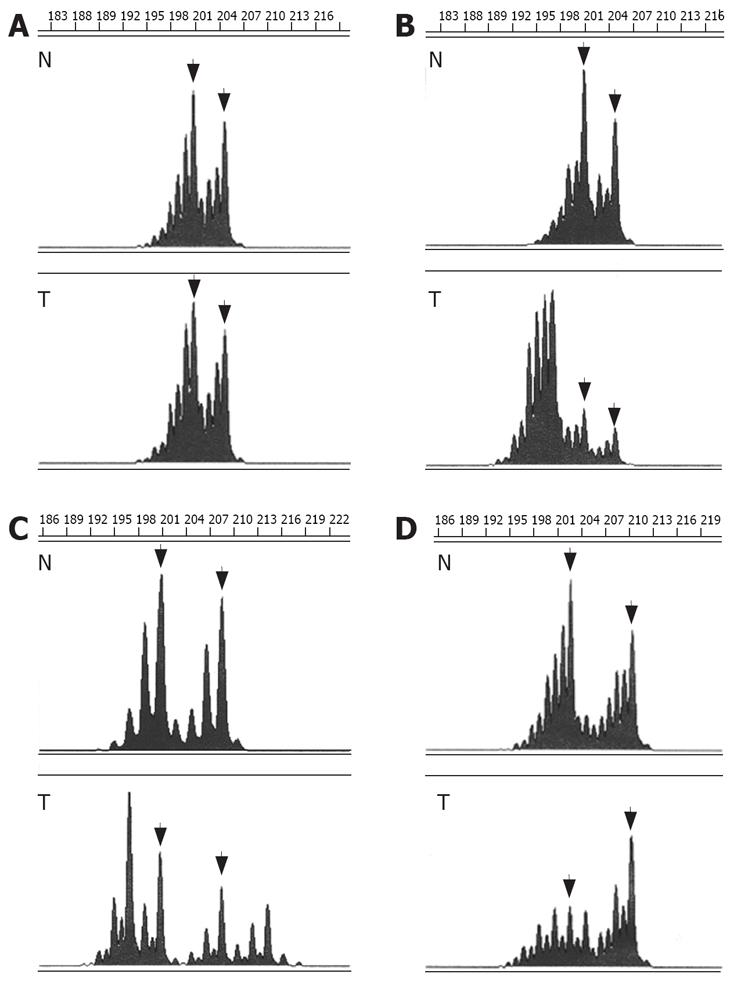
Figure 1 Examples of MSI and AI of EGFR CA-SSR I in colorectal tumors.
(A, B, C, and D) show heterozygosity for CA-SSR I in normal tissue (N). (A) shows no instability nor AI (AI score = 0.99) in colorectal tumor (T) of the same patient; (B) shows MSI with additional shortened alleles in colorectal tumor; (C) shows MSI with combined shortened and elongated alleles in colorectal tumor; and (D) shows AI (AI score = 3.03) in colorectal tumor. Arrows indicate germline alleles.
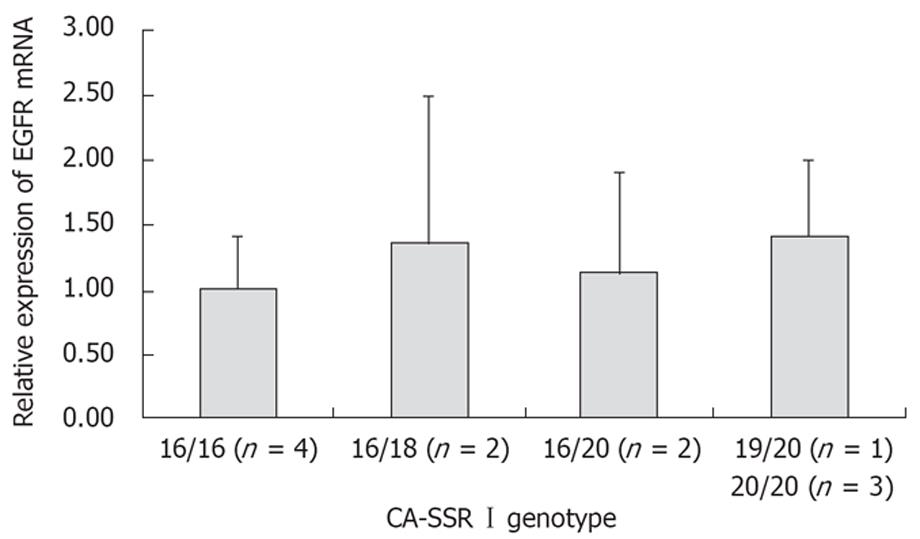
Figure 2 Graphical representation of the influence of the CA-SSRI genotype on EGFR mRNA expression in normal colon.
Expression levels were determined by QRT-PCR. Relative expression levels are given in percent, relative to expression levels determined in normal colons with a 16/16 genotype. Median values with the corresponding standard deviations are indicated. Two by two comparisons, P > 0.468 (Mann-Whitney U test).
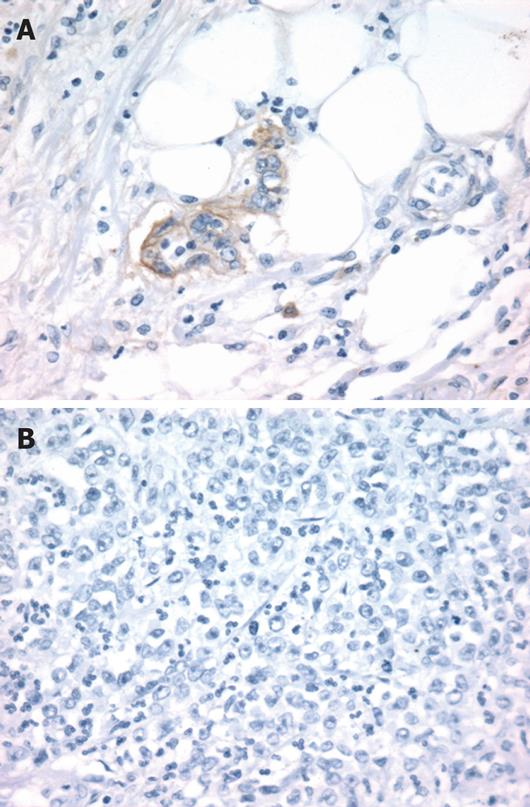
Figure 3 Examples of EGFR immunohistochemical stainings in colorectal tumors harboring identical EGFR CA-SSR I status and genotype.
(A and B) are CA-SSR I MSS colorectal tumors with genotype 16/20; (A) shows a moderate membranous staining for EGFR (score ++), whereas (B) is negative (x 400; hematoxylin counterstain).
-
Citation: Buisine MP, Wacrenier A, Mariette C, Leteurtre E, Escande F, Aissi S, Ketele A, Leclercq A, Porchet N, Lesuffleur T. Frequent mutations of the CA simple sequence repeat in intron 1 of
EGFR in mismatch repair-deficient colorectal cancers. World J Gastroenterol 2008; 14(7): 1053-1059 - URL: https://www.wjgnet.com/1007-9327/full/v14/i7/1053.htm
- DOI: https://dx.doi.org/10.3748/wjg.14.1053


