Copyright
©2008 The WJG Press and Baishideng.
World J Gastroenterol. Feb 21, 2008; 14(7): 1044-1052
Published online Feb 21, 2008. doi: 10.3748/wjg.14.1044
Published online Feb 21, 2008. doi: 10.3748/wjg.14.1044
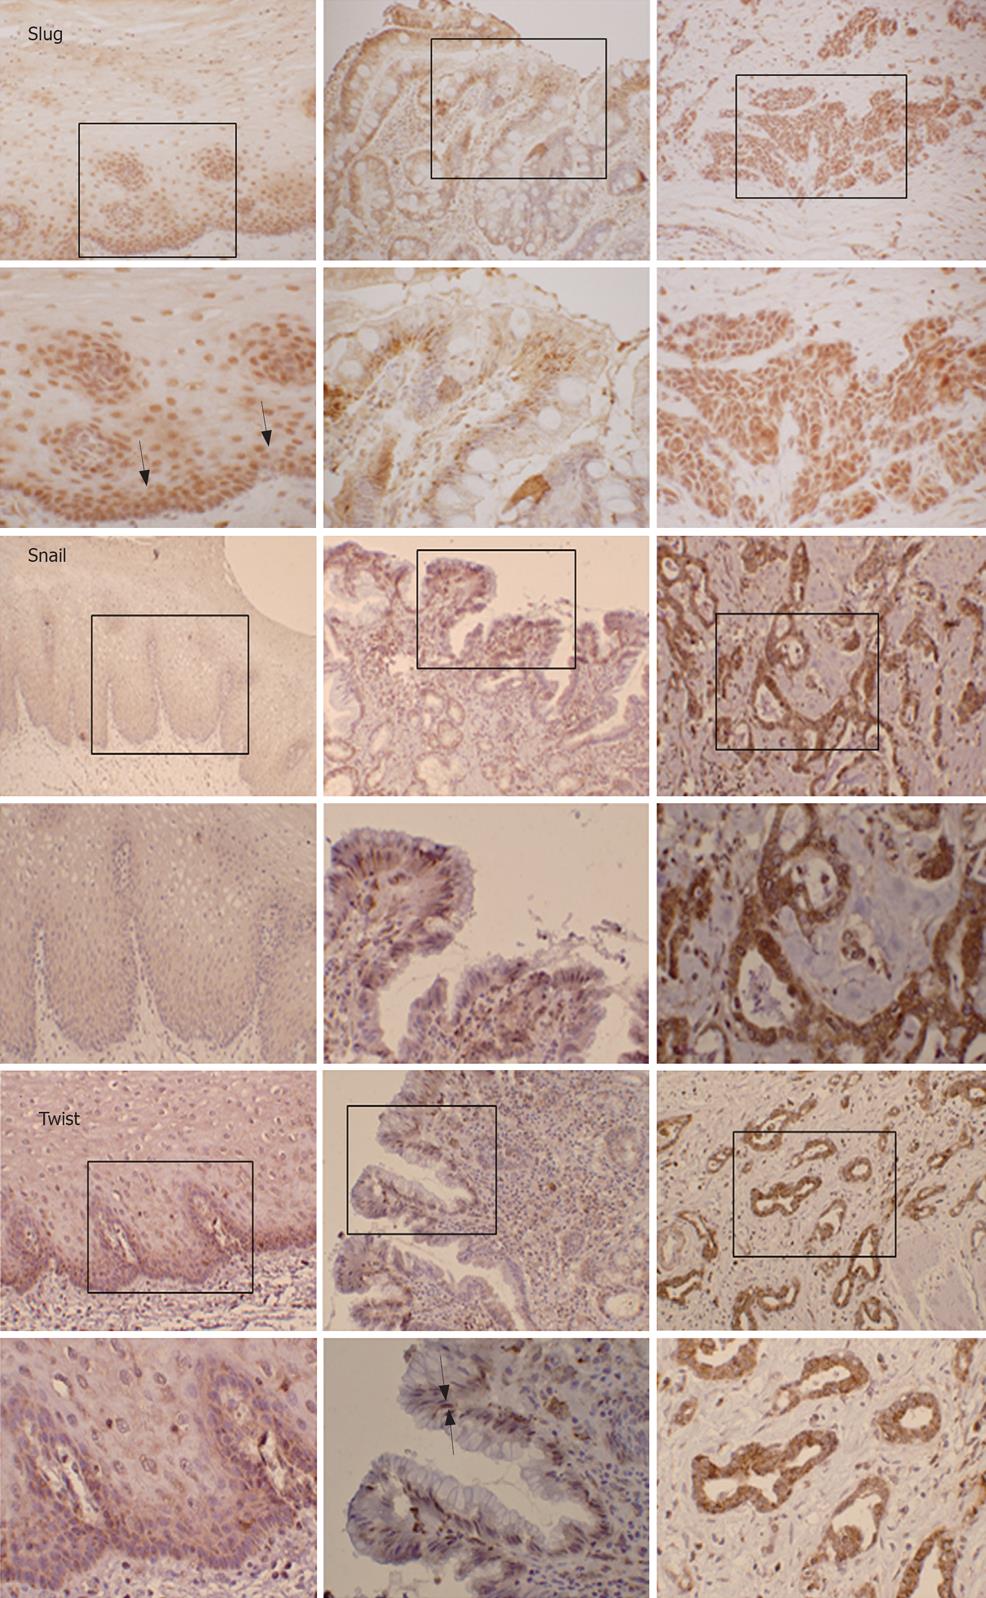
Figure 1 Immunolocalization of Slug, Snail and Twist in normal esophagus, intestinal type Barrett’s metaplasia and oesophageal adenocarcinoma.
Normal squamous esophagus (S), intestinal type Barrett’s metaplasia (BM) and esophageal adenocarcinoma (ADC) were subjected to immunohistochemistry using antibodies to Slug, Snail and Twist. Arrows denote areas of positivity (× 20, × 40).
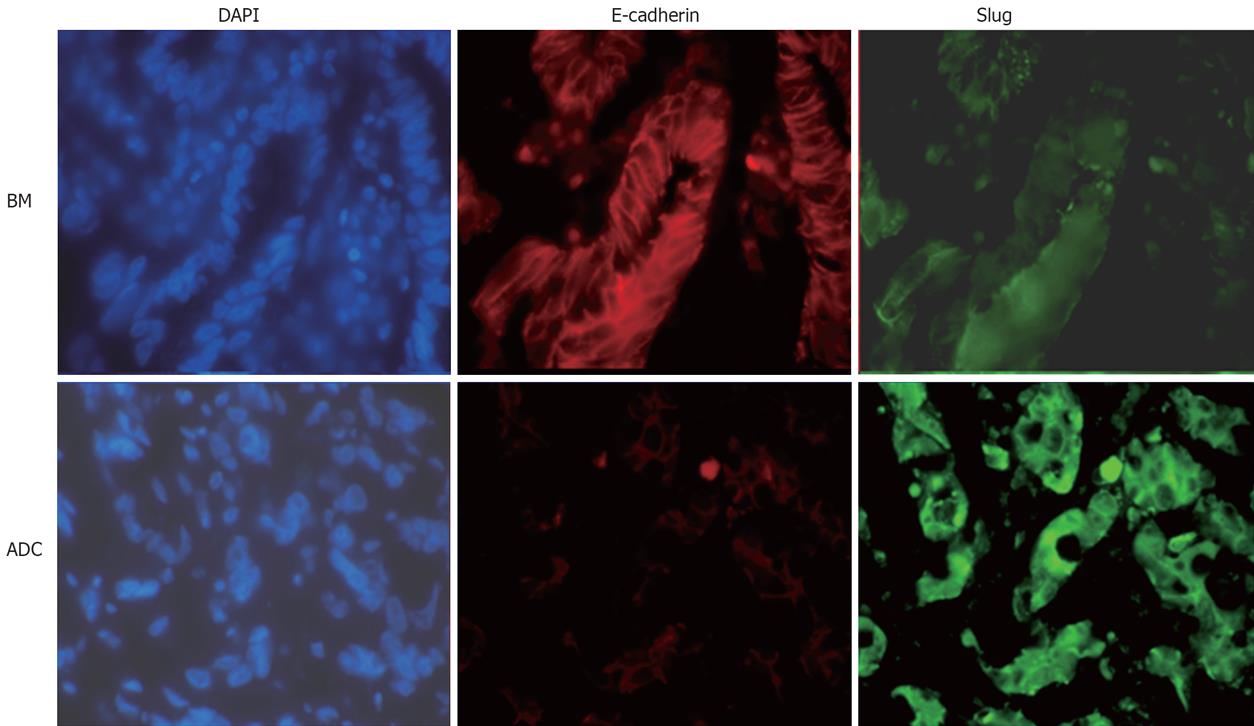
Figure 2 Co-immunofluoresence of Slug and E-cadherin in Barrett’s metaplasia and esophageal adenocarcinoma.
Sections of Barrett's metaplasia (BM) mostly demonstrate preserved cell border E-cadherin (Texas Red) immunoreactivity consistent with its role in cell-cell adhesion. Slug (FITC) immunoreactivity in BM however was minimal and appeared non specific. Conversely in sections of adenocarcinoma (ADC) in areas of abundant Slug immunoreactivity, there was negligible E-cadherin immunoreactivity. DAPI staining was used to highlight nuclei in sections (× 40).
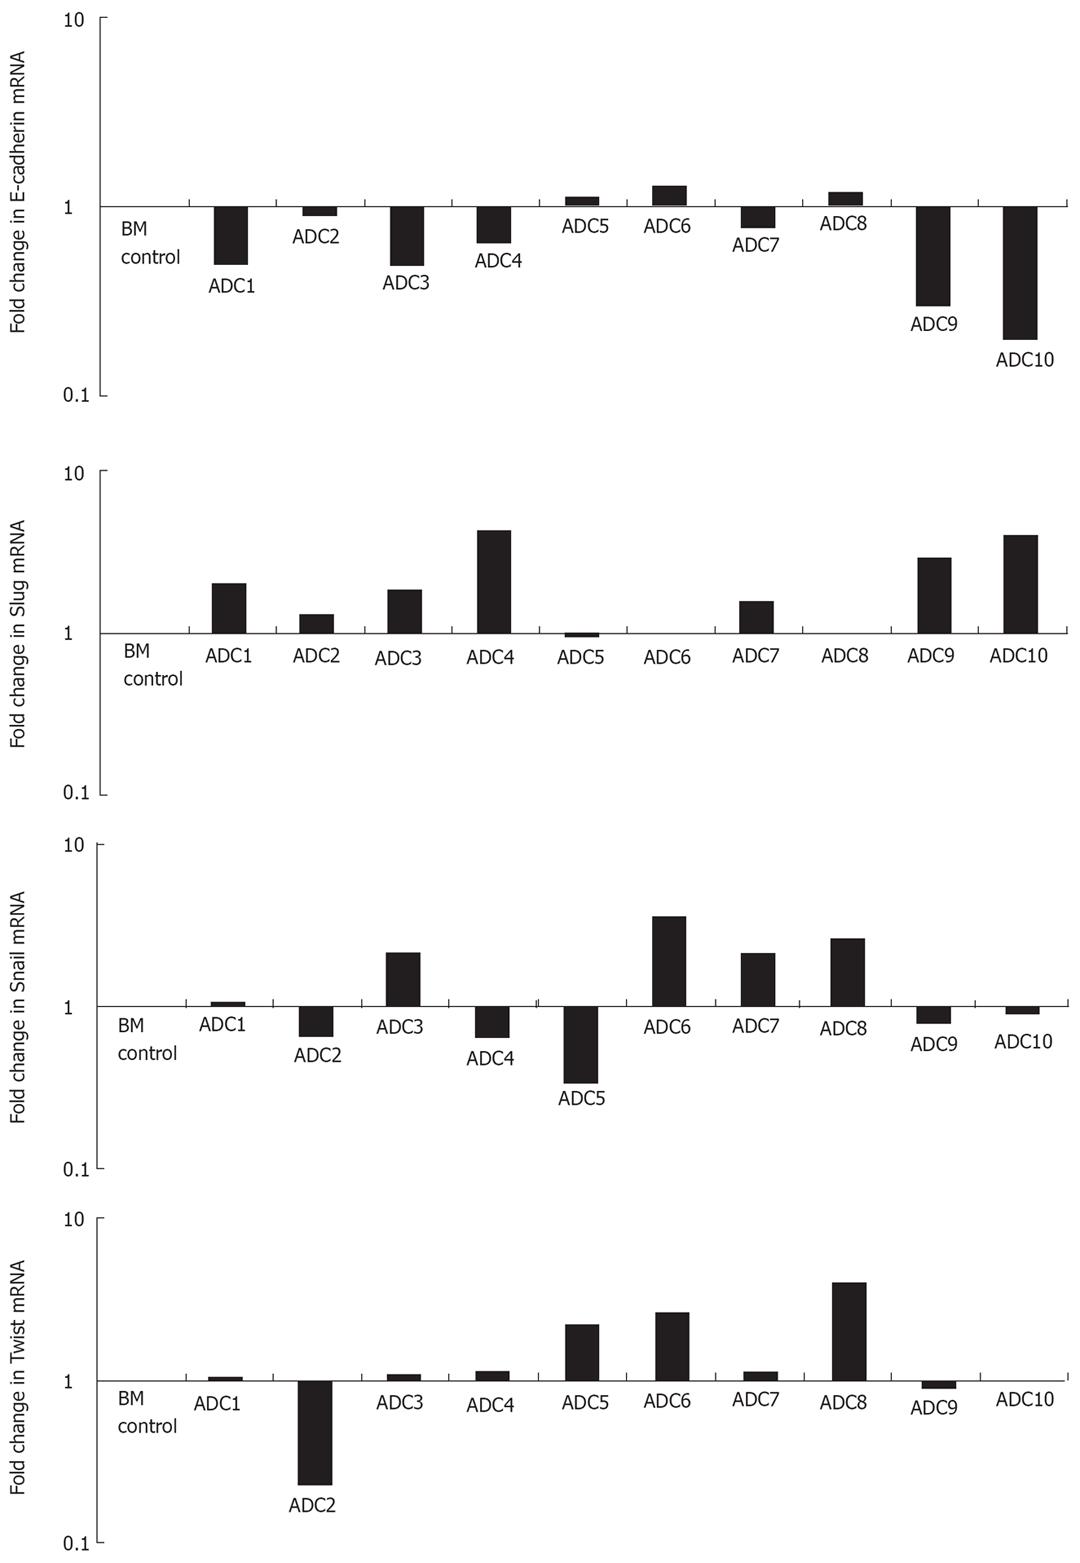
Figure 3 mRNA expression of E-cadherin, Slug, Snail and Twist in esophageal adenocarcinoma.
Real time RT-PCR was employed to examine the expression of E-cadherin, Slug, Snail and Twist in ten esophageal adenocarcinoma specimens (ADC1-ADC10) each compared to Barrett’s metaplastic tissue collected from the same resection specimen. Barrett’s metaplastic tissue control (BM), normalized to 1.0.
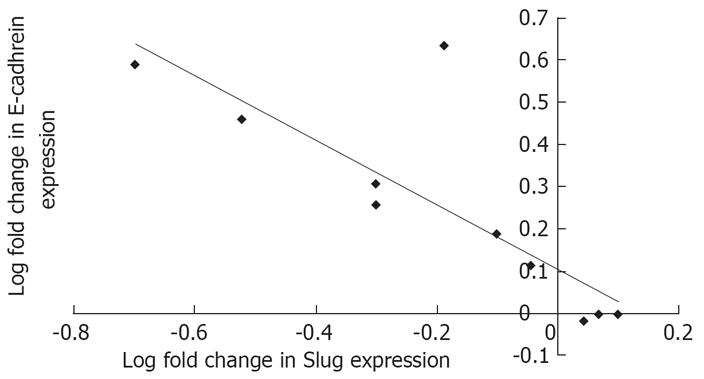
Figure 4 Correlation of E-cadherin and Slug mRNA expression in esophageal adenocarcinoma specimens.
Using linear regression analysis, Slug mRNA expression was demonstrated to be negatively correlated with E-cadherin expression in the ten adenocarcinoma specimens examined (ADC1-10) (R2 0.677, P < 0.03).
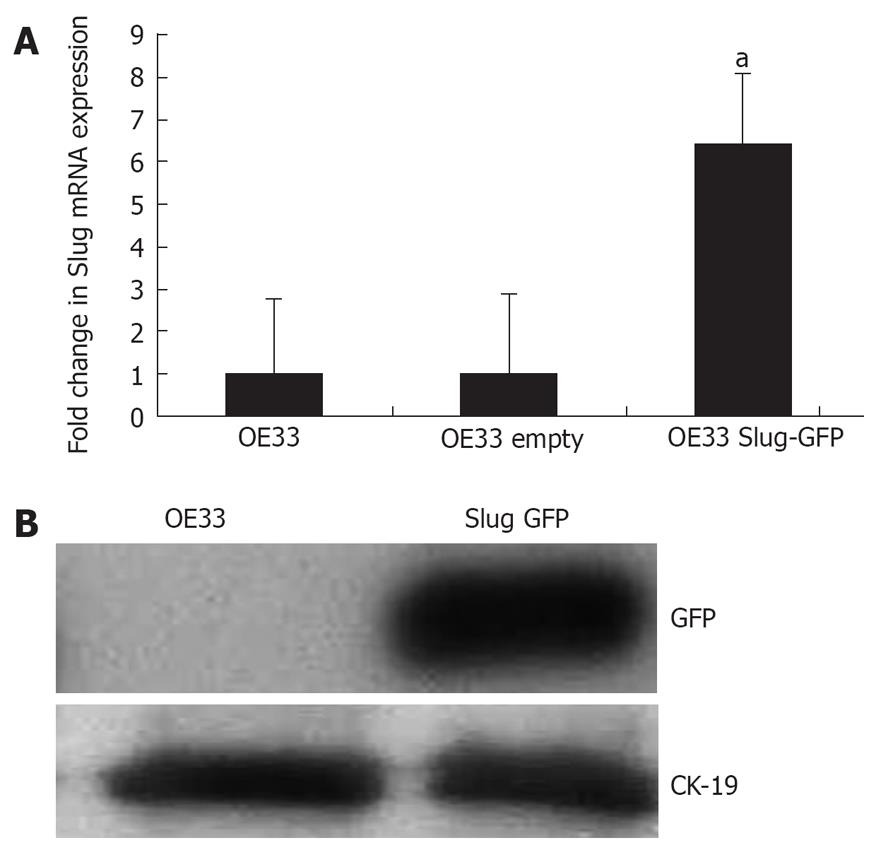
Figure 5 Overexpression of Slug in the esophageal adenocarcinoma derived cell line OE33.
Cell line OE33 was transiently transfected with either full length human Slug-GFP vector (OE33 Slug-GFP) or with the control empty GFP vector (OE33 empty). 24 h post transfection, (A) Slug mRNA and (B) GFP protein expression was determined. CK-19 was used as an epithelial control. aP < 0.05 using Student's t test.
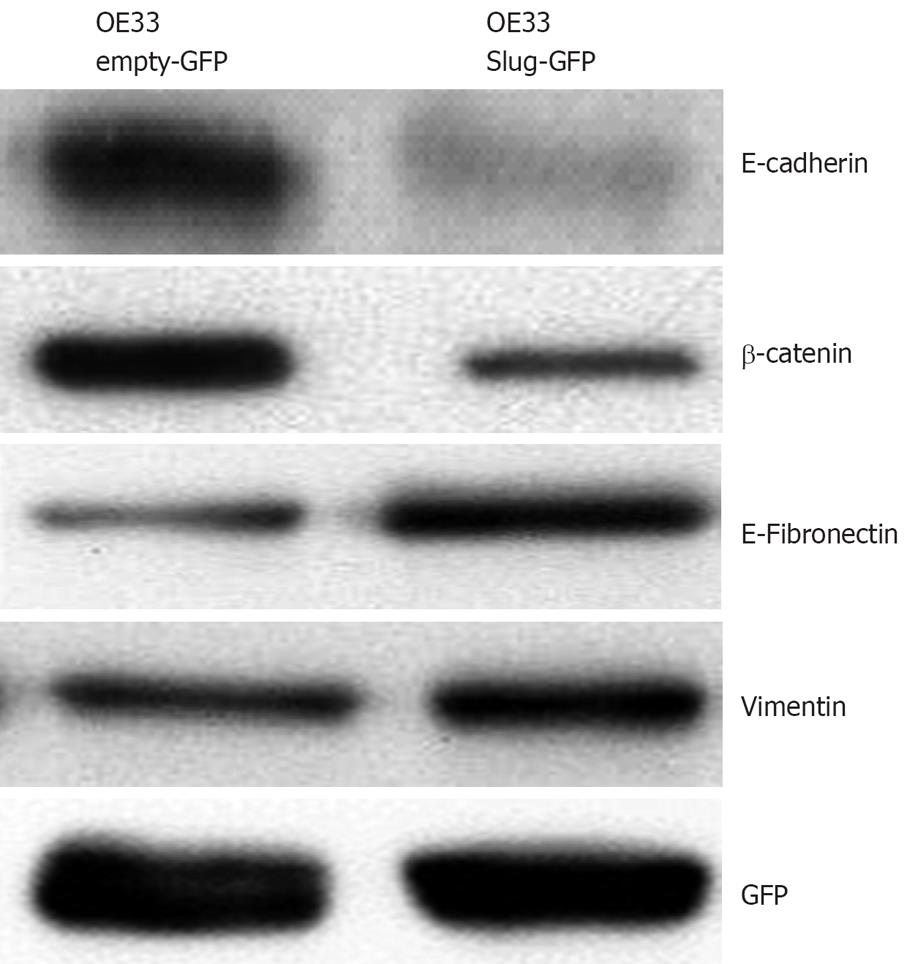
Figure 6 The effect of Slug overexpression on proteins implicated in EMT.
Expression of E-cadherin, beta-catenin, fibronectin and vimentin were all examined in Slug over-expressing (OE33 Slug-GFP) and control cells (OE33 empty-GFP). Lysates were normalized using GFP expression.
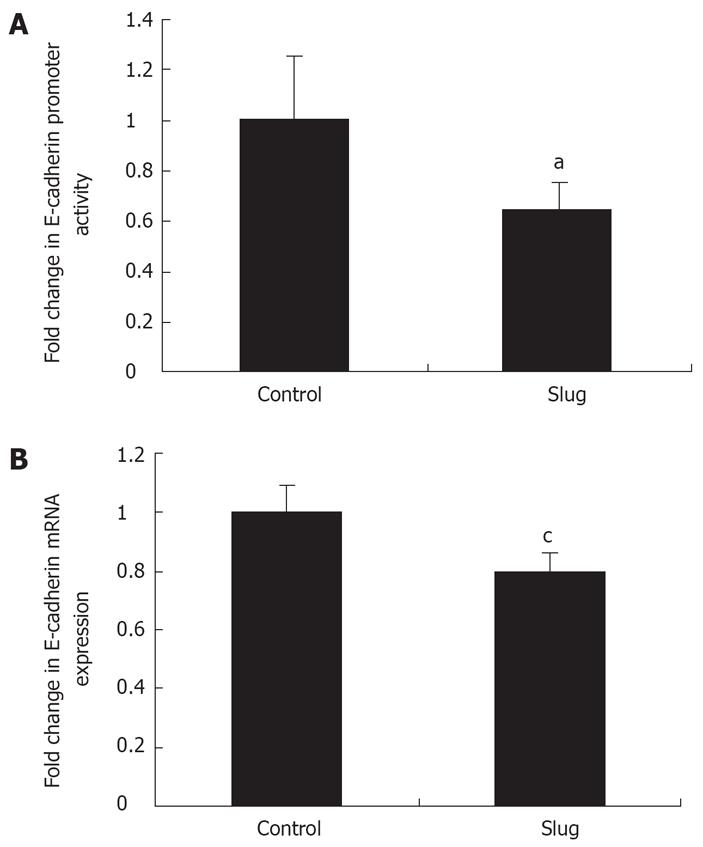
Figure 7 Slug expression causes a decrease in E-cadherin promoter activity and mRNA expression.
A: OE33 cells transfected with full length human Slug (Slug) showed decreased E-cadherin promoter activity compared to sham transfected control cells. Promoter activity was expressed as a fold change in relative luciferase units (RLU) compared to control cells. Results represent the means ± SE of three independent experiments. aP < 0.05 using Student’s t test; B: Expression of E-cadherin mRNA in Slug over-expressing cells (Slug) was also repressed in comparison to control cells (control). Relative gene expression was normalized to 1.0 (100%) of controls. Error bars = 2 mean ± SE. cP < 0.05 using Student’s t test. These data are the mean of three independent experiments.
- Citation: Jethwa P, Naqvi M, Hardy RG, Hotchin NA, Roberts S, Spychal R, Tselepis C. Overexpression of Slug is associated with malignant progression of esophageal adenocarcinoma. World J Gastroenterol 2008; 14(7): 1044-1052
- URL: https://www.wjgnet.com/1007-9327/full/v14/i7/1044.htm
- DOI: https://dx.doi.org/10.3748/wjg.14.1044


