Copyright
©2008 The WJG Press and Baishideng.
World J Gastroenterol. Dec 28, 2008; 14(48): 7321-7328
Published online Dec 28, 2008. doi: 10.3748/wjg.14.7321
Published online Dec 28, 2008. doi: 10.3748/wjg.14.7321
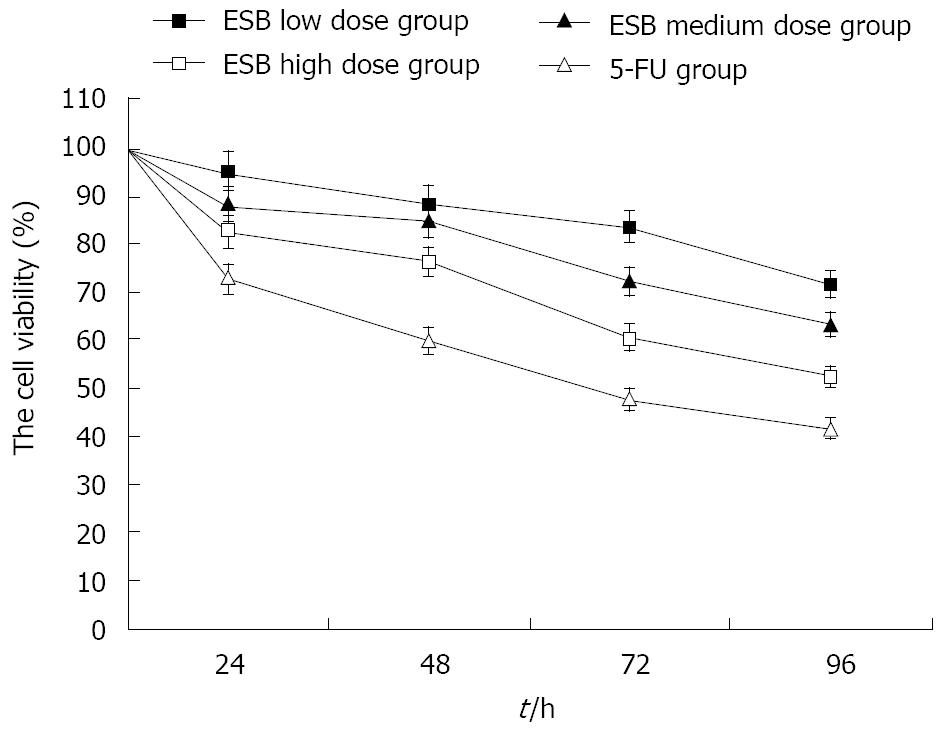
Figure 1 Inhibition of H22 cell proliferation by ESB.
H22 cells were treated with different doses of ESB. The number of cells was determined at 0, 24, 48, 72, and 96 h, respectively. The viability of cells was detected by MTT assay. ANOVA analysis showed that the growth of H22 cells was inhibited by ESB in a dose- and time- dependent manner (P < 0.05).
Figure 2 Morphological observation of H22 cells by EM after treatment.
A: normal hepatoma H22 cells (5000 ×); B: karyopyknosis and chromatic agglutination in high ESB dose group (5000 ×); C: apoptotic body in high ESB dose group (5000 ×); D: chondriosome swelling in high ESB dose group (6000 ×); E: cellular swelling and necrosis in 5-FU group (5000 ×).
Figure 3 Cell apoptosis observed with Hoechst 33258 staining under a fluorescence microscope (× 200).
After cells were treated with different doses of ESB for 48 h, Hoechst 33258 staining was used to observe apoptotic cells as described in MATERIALS AND METHODS. The number of apoptotic cells gradually increased in a dose-dependent manner with marked morphological changes found in cell apoptosis including condensation of chromatin and nuclear fragmentation. A: Control group; B: Low dose treated group; C: Medium dose treated group; D: High dose treated group.
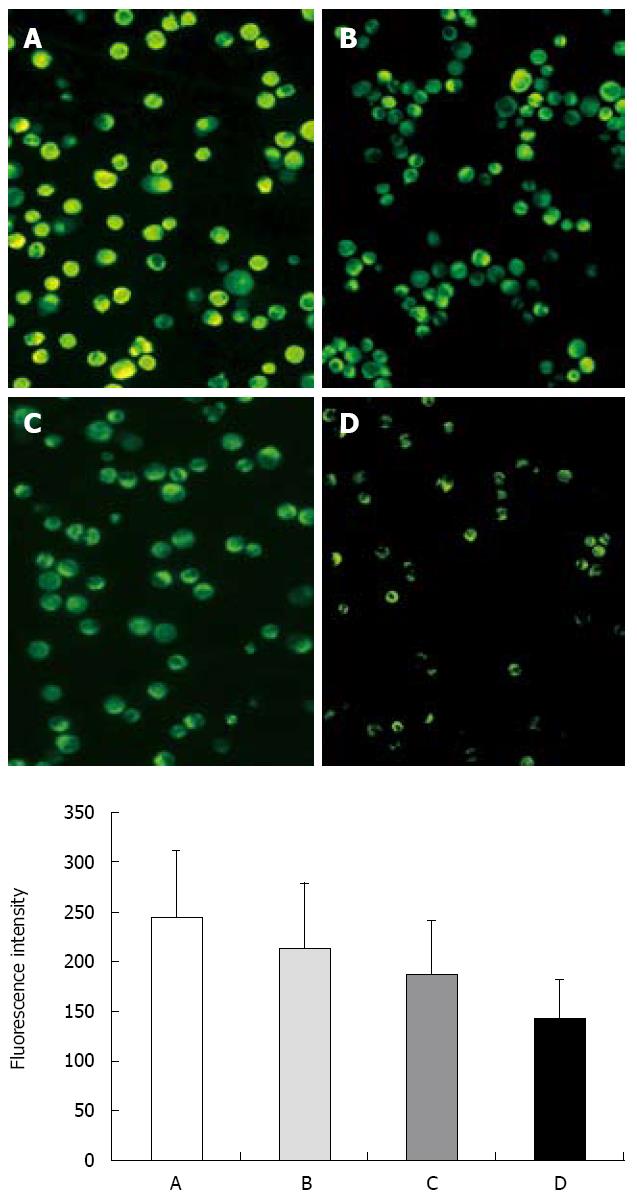
Figure 4 Effect of ESB on ∆ψm measured with laser scanning confocal microscope by staining with Rhodamine 123 (200 ×).
A: Control group; B: Low ESB dose group; C: Medium ESB dose group; D: High ESB dose group. Fluorescence intensity (FI) indicates membrane potential of mitochondria in the cells. FI was decreased in a dose-dependent manner (P < 0.05, ANOVA analysis).
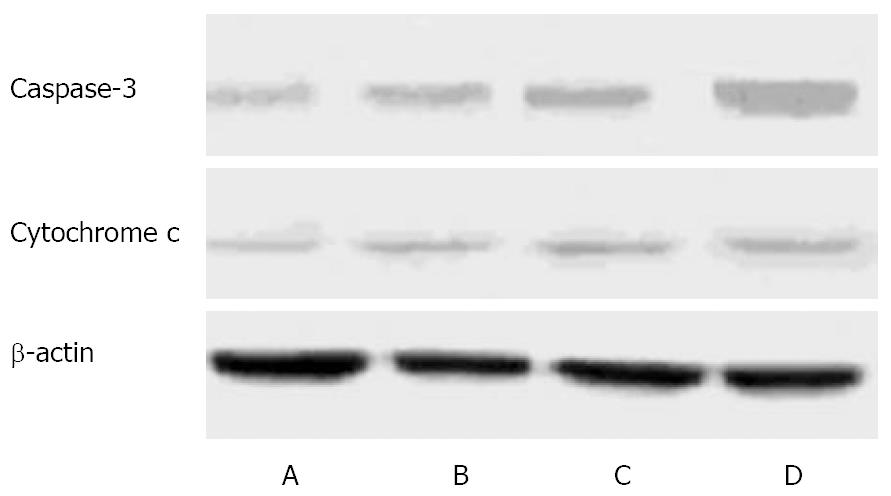
Figure 5 Protein level of caspase-3 and cytochrome C in H22 cells.
A: Control group; B: Low ESB dose group; C: Medium ESB dose group; D: High ESB dose group. After treatment with different doses of ESB for 48 h, cellular proteins were detected by Western blot analysis.
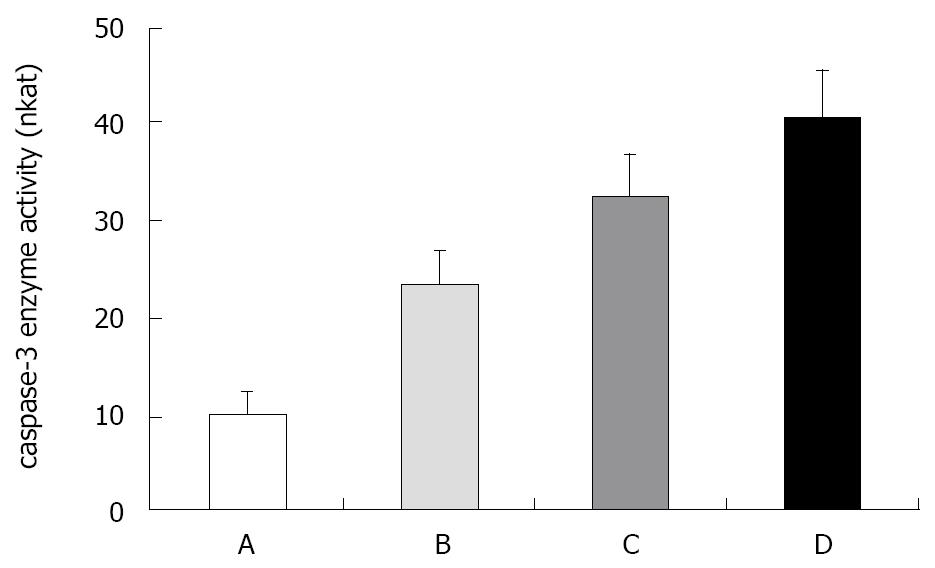
Figure 6 Effect of ESB on caspase-3 enzyme activity in H22 cells.
A: Control group; B: Low ESB dose group; C: Medium ESB dose group; D: High ESB dose group. There was a dose dependent increase in activity of caspase-3 enzyme in ESB treated cells (P < 0.05). This assay was done triplicate, independently. Nkat was used to represent activity measured.
-
Citation: Dai ZJ, Wang XJ, Li ZF, Ji ZZ, Ren HT, Tang W, Liu XX, Kang HF, Guan HT, Song LQ.
Scutellaria barbate extract induces apoptosis of hepatoma H22 cellsvia the mitochondrial pathway involving caspase-3. World J Gastroenterol 2008; 14(48): 7321-7328 - URL: https://www.wjgnet.com/1007-9327/full/v14/i48/7321.htm
- DOI: https://dx.doi.org/10.3748/wjg.14.7321


