Copyright
©2008 The WJG Press and Baishideng.
World J Gastroenterol. Dec 21, 2008; 14(47): 7225-7230
Published online Dec 21, 2008. doi: 10.3748/wjg.14.7225
Published online Dec 21, 2008. doi: 10.3748/wjg.14.7225
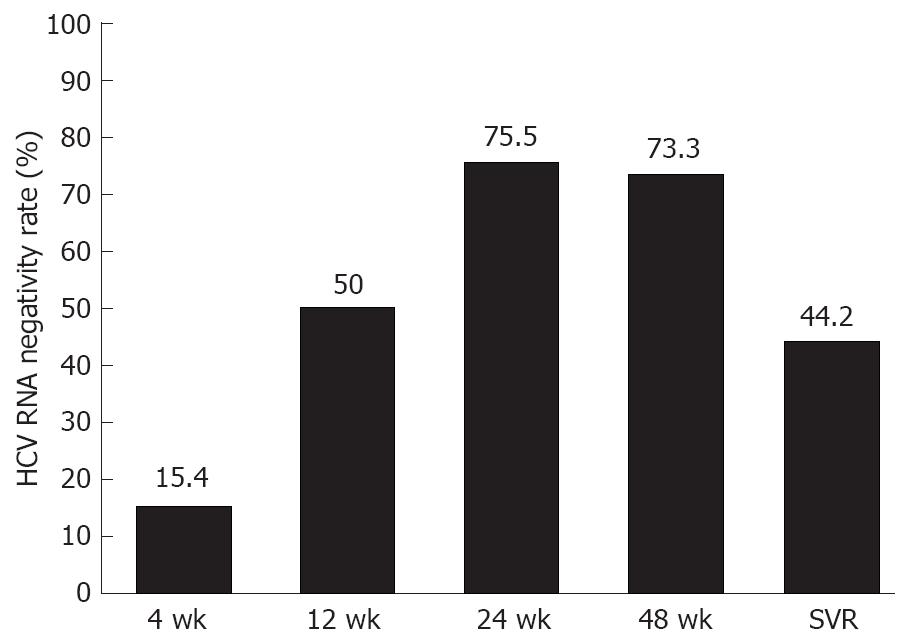
Figure 1 The transition rate of HCV RNA negativity with time.
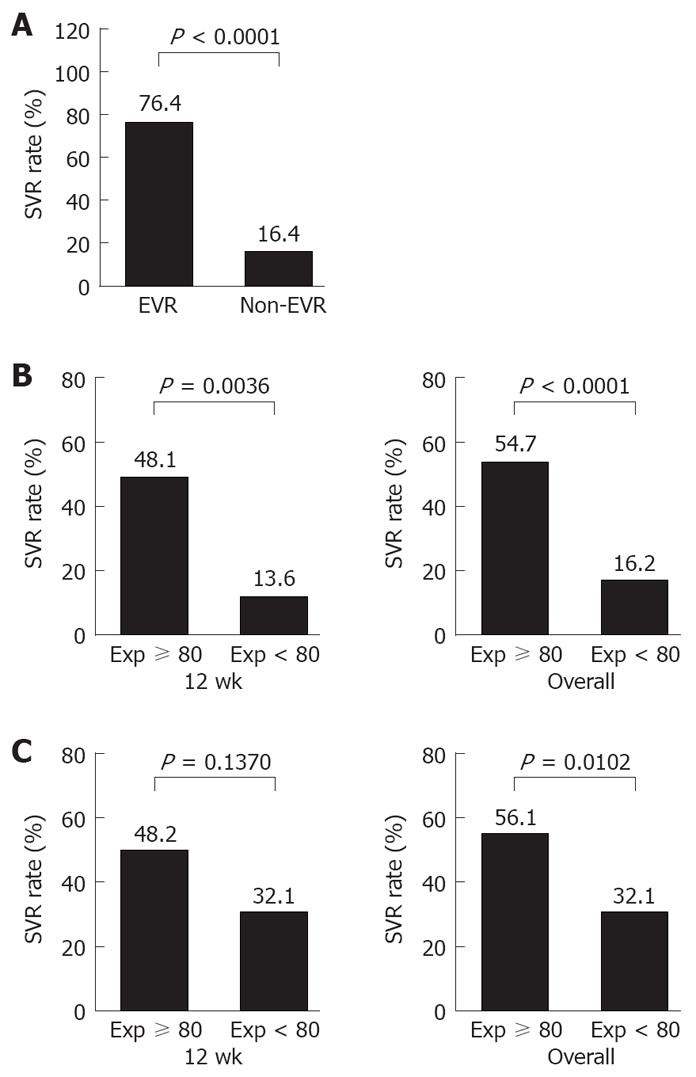
Figure 2 The clinical parameters associated with SVR rate using univariate analysis.
A: The relationship between EVR and SVR rate; B: The relationship between cumulative exposure to peg-IFN and SVR rate; C: The relationship between cumulative exposure to RBV and SVR rate.
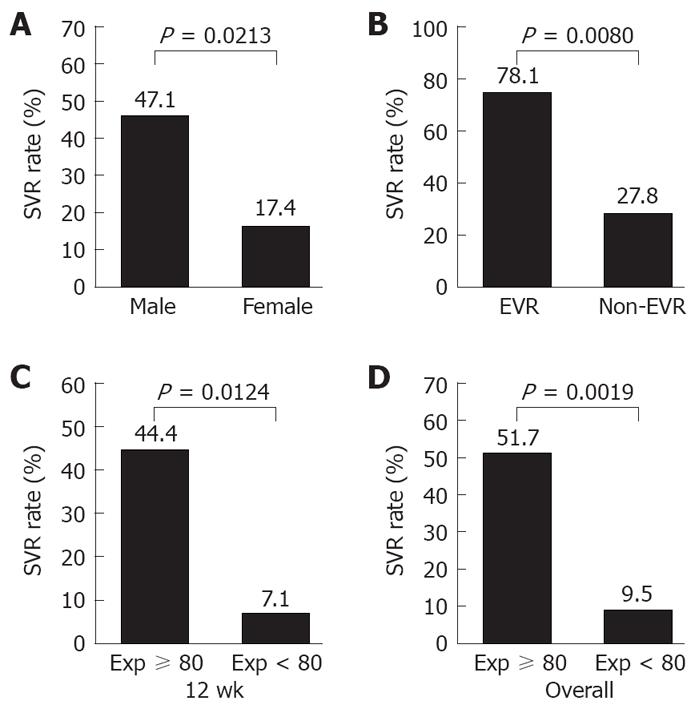
Figure 3 Clinical parameters in the older patient group (> 56 yr) associated with SVR rate using univariate analysis.
A: The relationship between sex and SVR rate; B: The relationship between EVR and SVR. C and D: The relationship between cumulative exposure to peg-IFN and SVR.
- Citation: Kogure T, Ueno Y, Fukushima K, Nagasaki F, Kondo Y, Inoue J, Matsuda Y, Kakazu E, Yamamoto T, Onodera H, Miyazaki Y, Okamoto H, Akahane T, Kobayashi T, Mano Y, Iwasaki T, Ishii M, Shimosegawa T. Pegylated interferon plus ribavirin for genotype Ib chronic hepatitis C in Japan. World J Gastroenterol 2008; 14(47): 7225-7230
- URL: https://www.wjgnet.com/1007-9327/full/v14/i47/7225.htm
- DOI: https://dx.doi.org/10.3748/wjg.14.7225


