Copyright
©2008 The WJG Press and Baishideng.
World J Gastroenterol. Dec 7, 2008; 14(45): 6960-6969
Published online Dec 7, 2008. doi: 10.3748/wjg.14.6960
Published online Dec 7, 2008. doi: 10.3748/wjg.14.6960
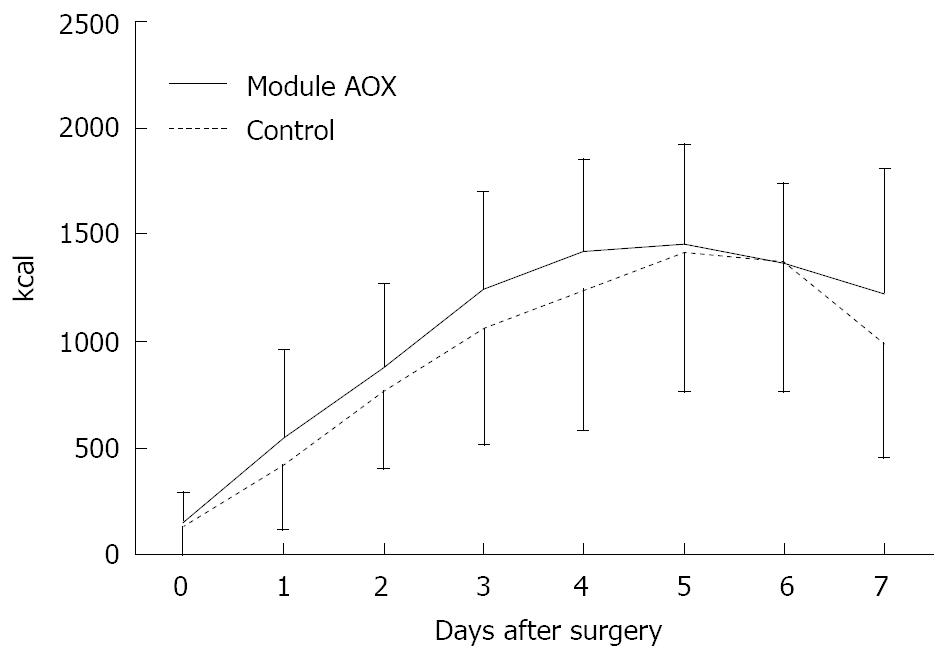
Figure 1 Intake of Kcal after surgery (mean ± SD).
Caloric intake on the day before and on 7 d after surgery in the control and treatment groups. No significant difference in intake was observed between the groups.
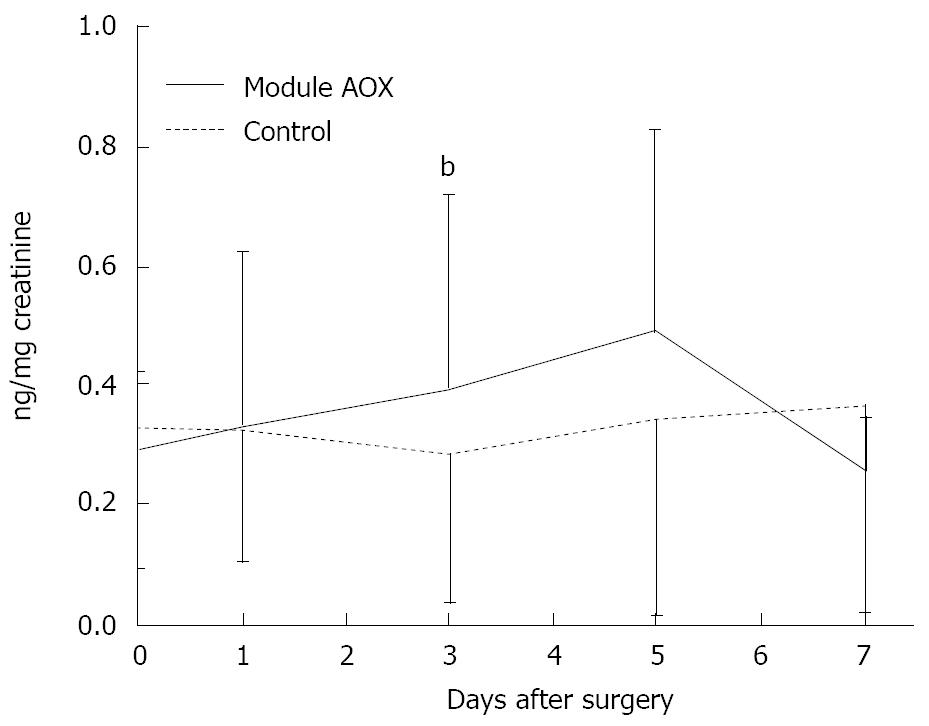
Figure 2 F2-Isoprostane after surgery (mean ± SD).
Development of F2-isoprostane in urine (ng/mg creatinine) after surgery in the control and treatment groups. The difference between the two groups over time was observed to be significant between the first and the third day after surgery, bP < 0.01.
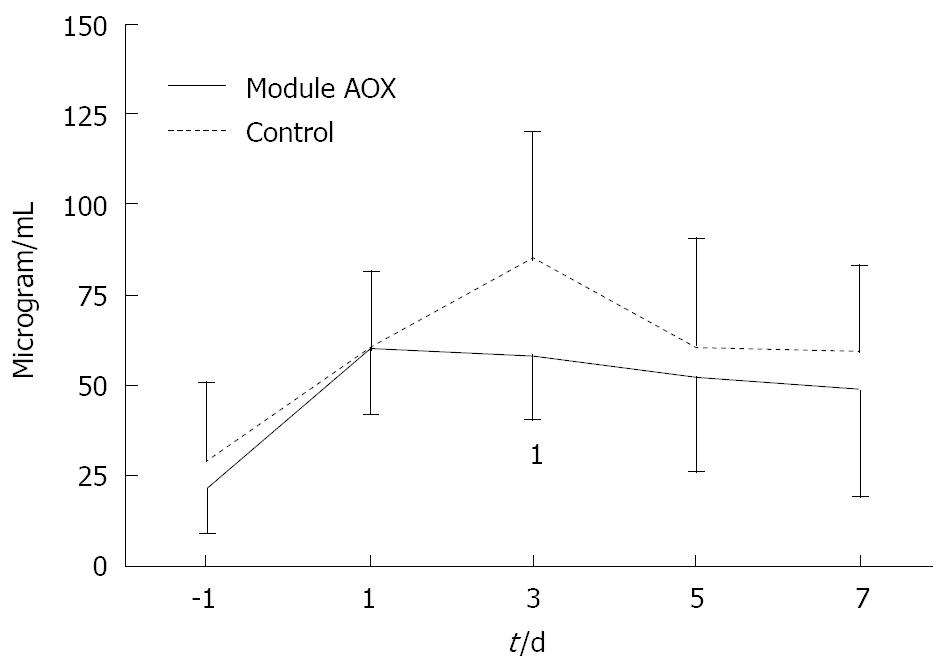
Figure 3 Development of LBP plasma concentration.
Data represent means ± SD. 1Indicates statistically significant difference between the control and treatment groups with respect to day 1.
- Citation: Stijn MFV, Ligthart-Melis GC, Boelens PG, Scheffer PG, Teerlink T, Twisk JW, Houdijk AP, Leeuwen PAV. Antioxidant enriched enteral nutrition and oxidative stress after major gastrointestinal tract surgery. World J Gastroenterol 2008; 14(45): 6960-6969
- URL: https://www.wjgnet.com/1007-9327/full/v14/i45/6960.htm
- DOI: https://dx.doi.org/10.3748/wjg.14.6960


