Copyright
©2008 The WJG Press and Baishideng.
World J Gastroenterol. Nov 14, 2008; 14(42): 6506-6512
Published online Nov 14, 2008. doi: 10.3748/wjg.14.6506
Published online Nov 14, 2008. doi: 10.3748/wjg.14.6506
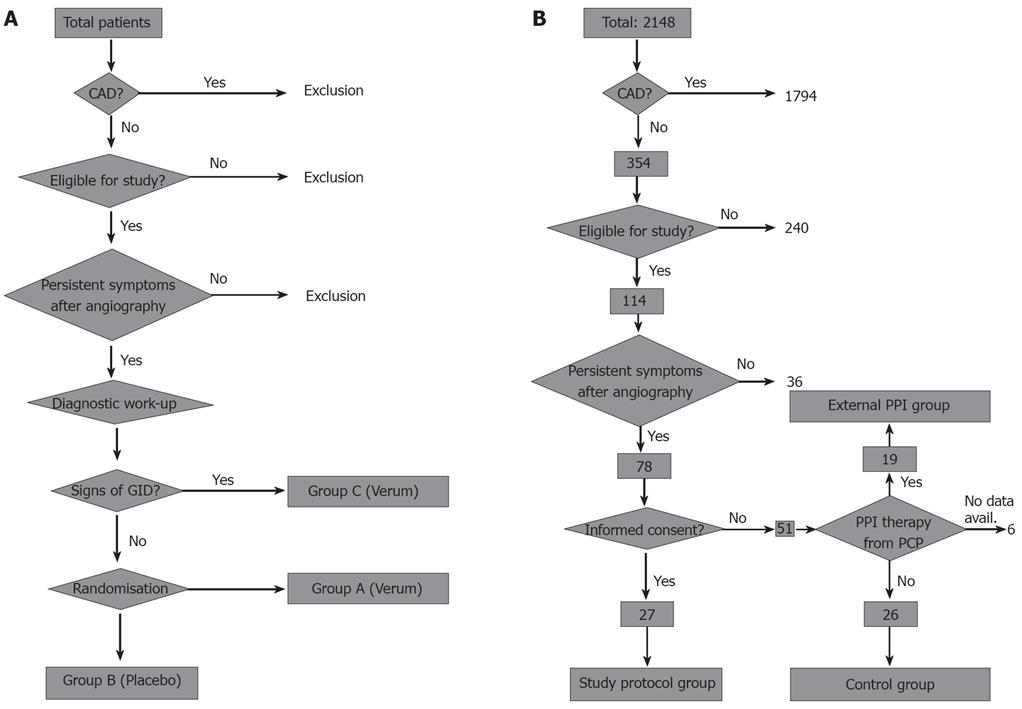
Figure 1 Study design.
A: Original study design with 3 patient groups. Randomization was planned after the diagnostic procedures in order to randomize only patients without overt signs of gastrointestinal disease. After recruitment of the first 10 patients only for patient group C, the other two patient groups were closed and the study design was adapted as depicted in B (CAD: Coronary artery disease; GID: Gastrointestinal disease); B: Adapted study design without randomization. To compare the results of per protocol treatment to patients treated in a non-standardized fashion or untreated patients, an external PPI group and a control group were built by recruiting patients who were treated by their primary care physicians (external PPI group, 19 patients) or were not willing to undergo treatment at all (control group, 26 patients). These patients were not matched to the study protocol group and most of them did not receive diagnostic procedure regarding gastrointestinal diseases (CAD: Coronary artery disease; PCP: Primary care physician).
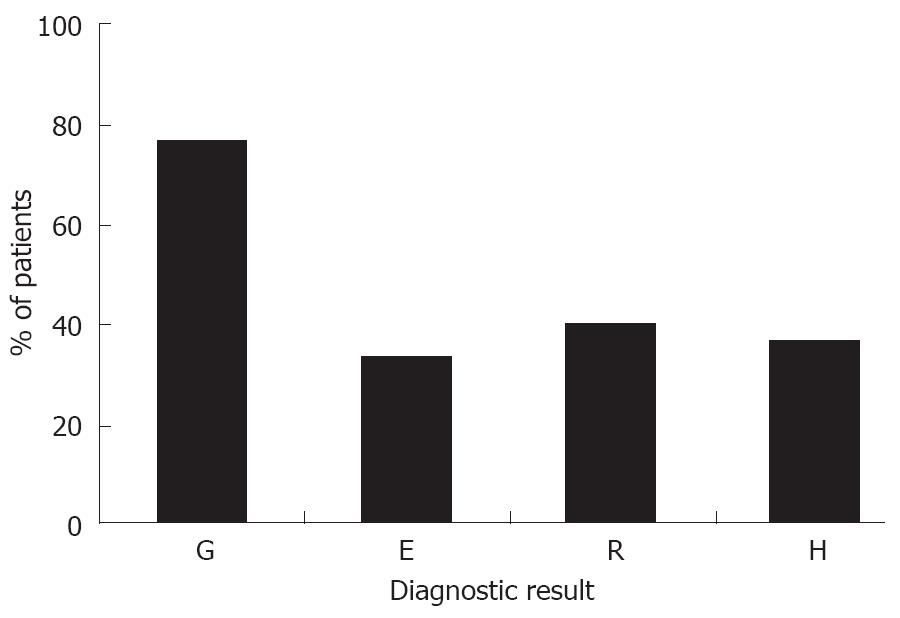
Figure 2 Percentage of study protocol patients with gastritis (G, partially erosive or ulcerative), esophagitis (E), reflux as diagnosed by pH monitoring (R) and/or hiatal hernia (H).
Multiple diagnoses in a patient were possible so that the total percentage is above 100.
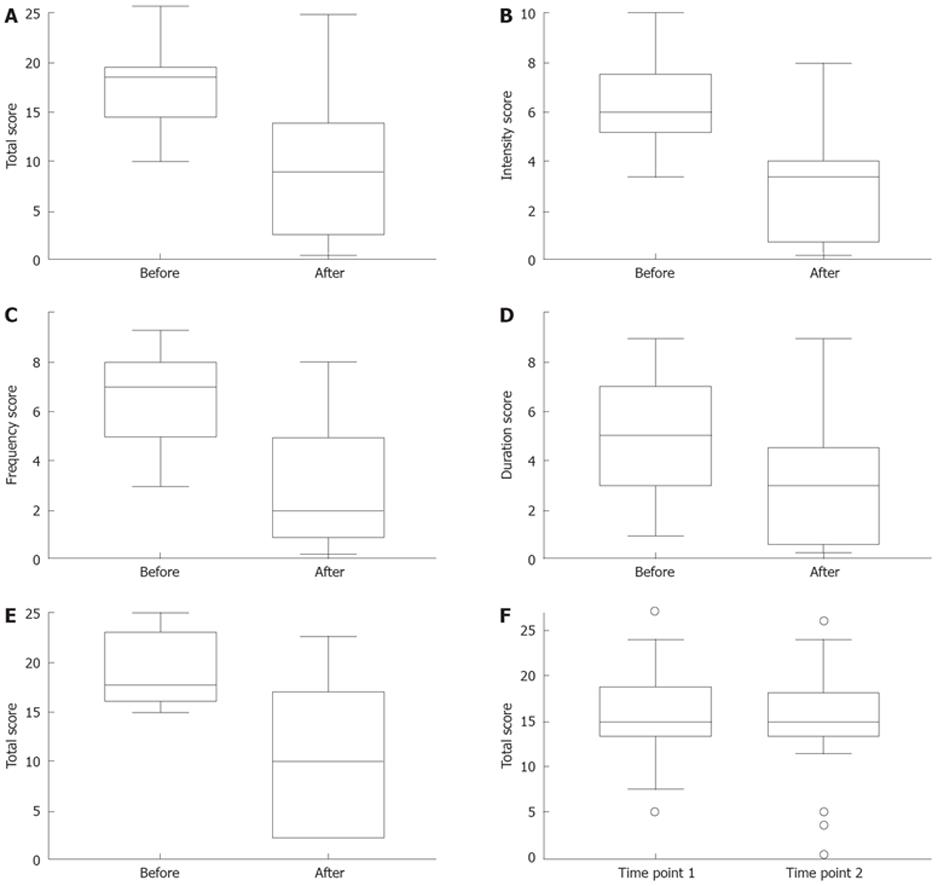
Figure 3 Results of the different group by graphical representation (parallel boxplot).
A: Total score; B: Intensity score; C: Frequency score; D: Duration score. The three symptom scores (B-D) are before and after treatment with pantoprazole in the study protocol group. There was statistically significant difference between the scores before and after therapy (P < 0.001 for all four scores). E: Graphical representation (parallel boxplot) of the total score before and after treatment in the external PPI group. The total score after treatment was significantly different compared to the total score before treatment (P = 0.0011); F: Graphical representation (parallel boxplot) of the total score before and after an observation period of 8 wk in the control group. There was no significant difference between the scores before and after the observation period (P = 0.2448).
- Citation: Dietrich CG, Laupichler S, Stanzel S, Winograd R, Al-Taie O, Gartung C, Geier A. Origin of and therapeutic approach to cardiac syndrome X: Results of the proton pump inhibitor therapy for angina-like lingering pain trial (PITFALL trial). World J Gastroenterol 2008; 14(42): 6506-6512
- URL: https://www.wjgnet.com/1007-9327/full/v14/i42/6506.htm
- DOI: https://dx.doi.org/10.3748/wjg.14.6506


