Copyright
©2008 The WJG Press and Baishideng.
World J Gastroenterol. Nov 14, 2008; 14(42): 6496-6502
Published online Nov 14, 2008. doi: 10.3748/wjg.14.6496
Published online Nov 14, 2008. doi: 10.3748/wjg.14.6496
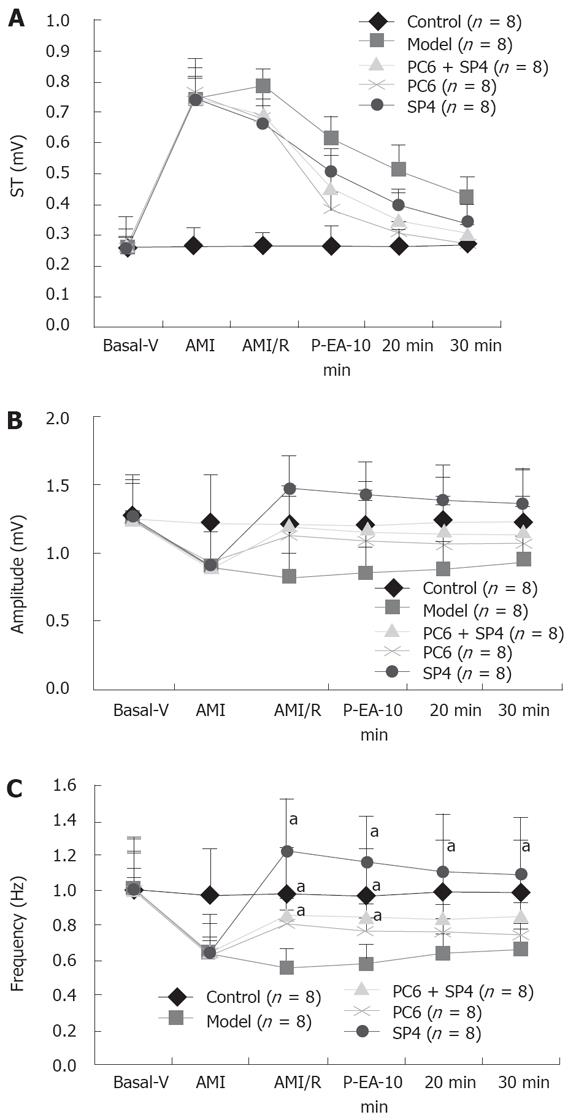
Figure 1 Changes in rabbit ECG-ST (mV, A), amplitude (mV, B) and frequency (pulses/s, C) of slow waves of electrogastrogram (EGG) in control, model, PC6, SP4 and PC6 + SP4 groups (n = 8 in each group) at different courses after acute myocardial ischemia and reperfusion (AMI/R).
aP < 0.05 vs model group; Basal-V: Basal value; P-EA: Post-EA.
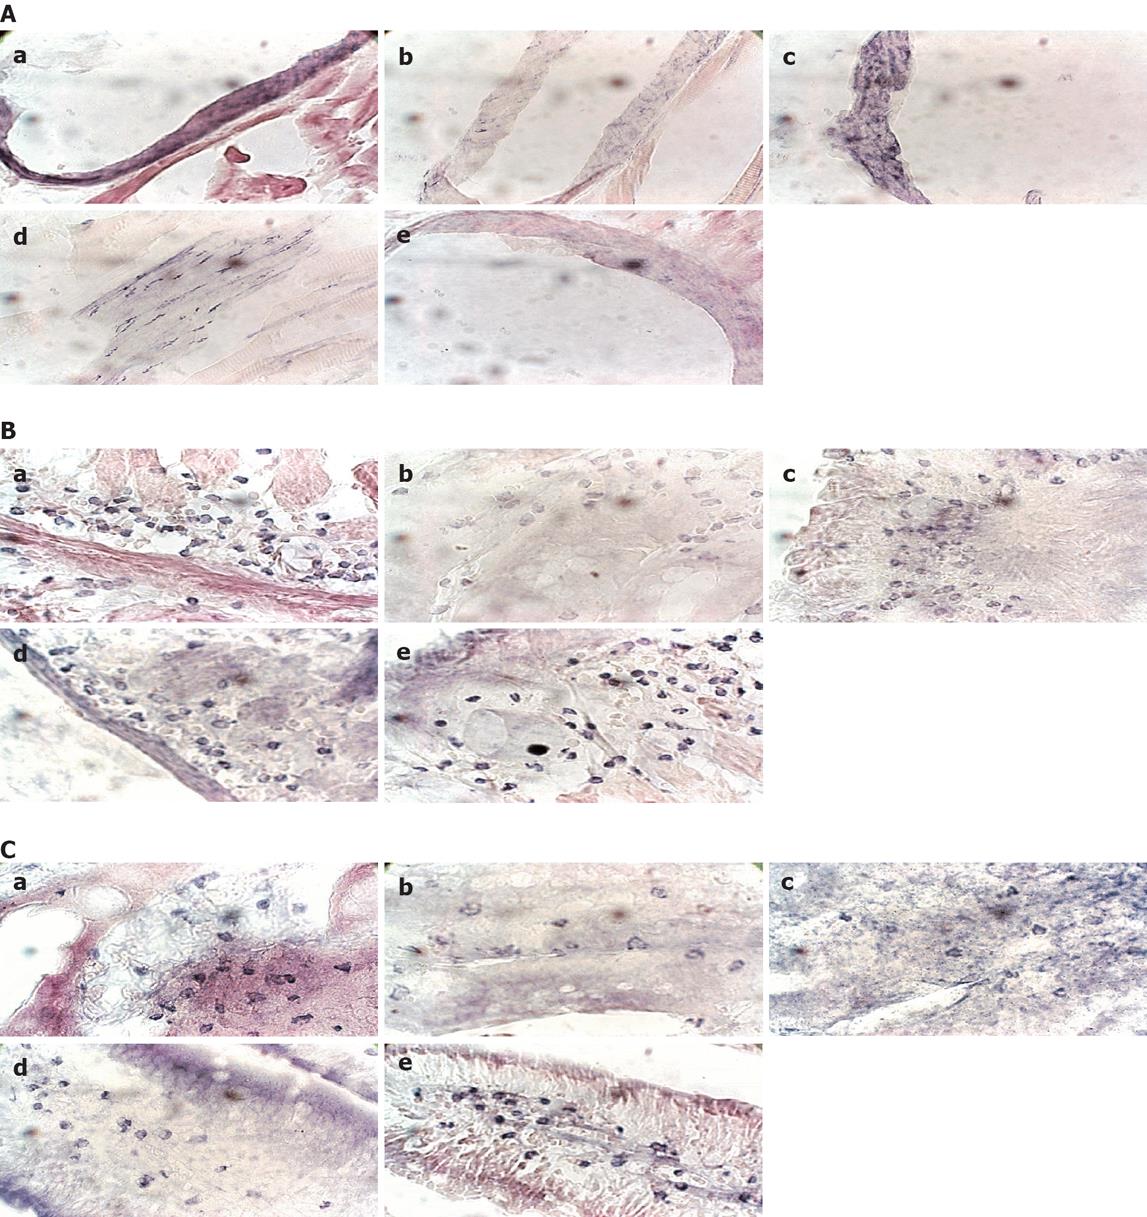
Figure 2 Photographs showing NOS expression in the myocardium of the rabbit heart base (left atrium, A), gastric antrum (B) and duodenum (C) in control (a), model (b), PC6 (c), PC6 + SP4 (d) and SP4 (e) groups.
A: NOS positive reaction product (in nerve fibers) presented string-of-beads-like distribution (dark blue color) on the wall of larger blood vessels along the longitudinal axis of the smooth muscle fibers. NOS-positive product was denser in control group (a), moderate in PC6 group (c), milder in PC6 + SP4 (d) and SP4 (e) groups, lightest in model group (b); B: NOS positive reaction neurons distributing in the mucous layer and underlayer of the rabbit gastric antrum; C: NOS positive reaction neurons distributing in the mucous layer and underlayer of the rabbit duodenum tissues. Most of them were round and oval, and fewer irregular polygon, and their kytoplasm was uniformly dark blue and their nuclei were relatively lighter in color. NOS-positive reaction product was denser in control group (a), moderate in SP4 group (e), milder in PC6 (c) and PC6 + SP4 (d) groups, lightest in model group (b). (× 400).
- Citation: Wang SB, Chen SP, Gao YH, Luo MF, Liu JL. Effects of electroacupuncture on cardiac and gastric activities in acute myocardial ischemia rats. World J Gastroenterol 2008; 14(42): 6496-6502
- URL: https://www.wjgnet.com/1007-9327/full/v14/i42/6496.htm
- DOI: https://dx.doi.org/10.3748/wjg.14.6496


