Copyright
©2008 The WJG Press and Baishideng.
World J Gastroenterol. Oct 28, 2008; 14(40): 6163-6170
Published online Oct 28, 2008. doi: 10.3748/wjg.14.6163
Published online Oct 28, 2008. doi: 10.3748/wjg.14.6163
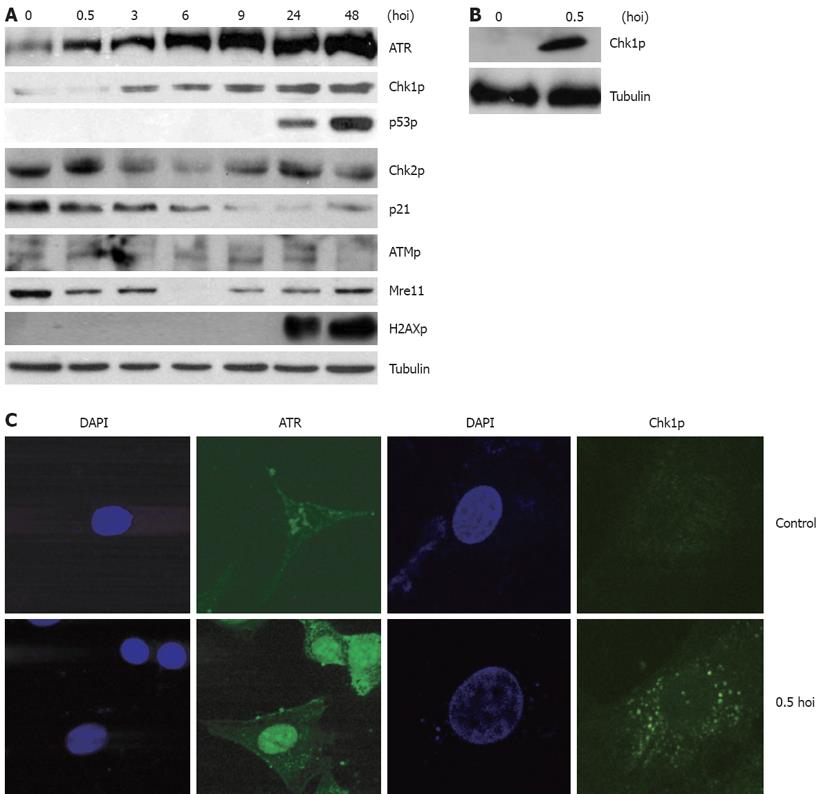
Figure 1 HBV infection activates a cellular checkpoint response dependent on ATR.
A: 105 human hepatocyte HL7702 monolayer cells in a 6-cm plate were infected with 106 virus particles from HBV-positive patients at 37°C under 50 mL/L CO2; normal serum from healthy individuals was used as a non-infected control. Prior to cell harvesting, the cells were washed eight times thoroughly to remove excess viral input. Whole-cell lysates were prepared at various times of infection (hoi) and subjected to an immunoblotting assay by using antibodies against the indicated proteins. Tubulin was used as the equal loading control; B: Primarily cultured hepatocyte cells were prepared and were harvested 3 h after HBV-positive serum addition. Whole cell lysates were prepared and subjected to immunoblotting assay by using Chk1 phosphorylation antibody; tubulin was used as the equal loading control; C: HL7702 cells were infected with HBV-positive serum for 0.5 h. Normal serum from healthy individuals was used as a non-infected control. Immunofluorescence with antibodies to Chk1 Ser-345 and ATR (green) were monitored. DNA was stained with DAPI (blue).
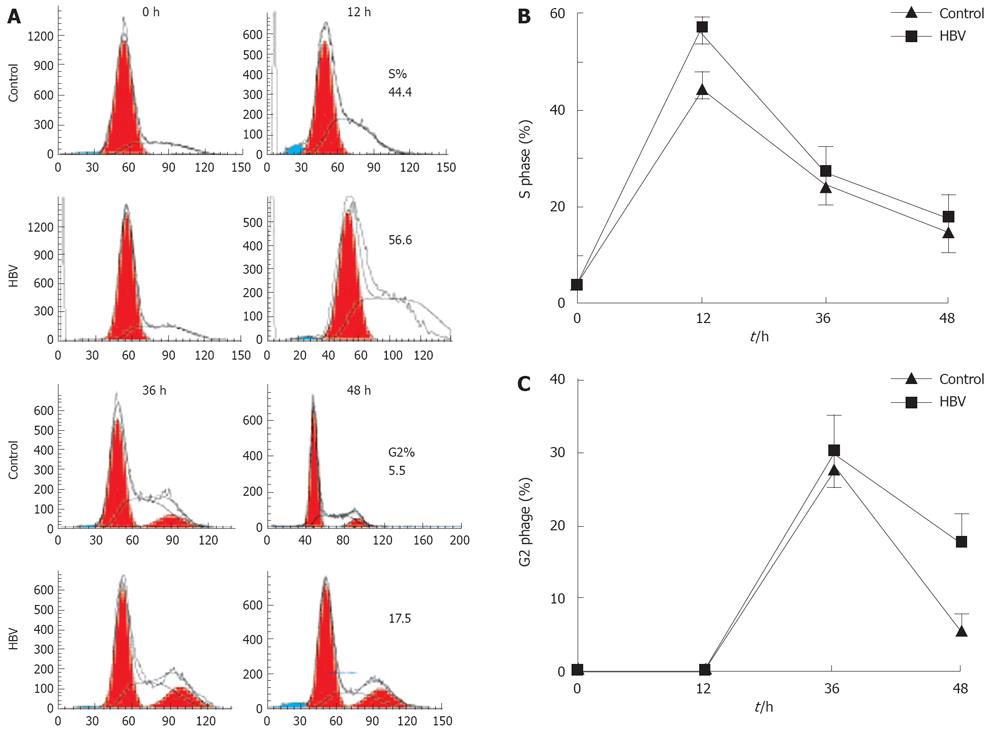
Figure 2 HBV infection caused transient cell cycle arrest in the S and the G2 phase.
The duration of the S and G2 phase were measured in HBV-infected or non-infected cells. Cells were synchronized with mimosine for 24 h, and then media were replaced with RPMI-1640 containing 10% HBV serum or normal serum. At indicated times, cells were harvested and examined for cell cycle profile using propidium iodide staining and flow cytometry. A: Cell cycle profile in HBV-infected cells and in non-infected cells; B: Percentages of cells in the S phase; C: Percentages of cells in the G2 phase. Mean and standard error are presented for three independent experiments.
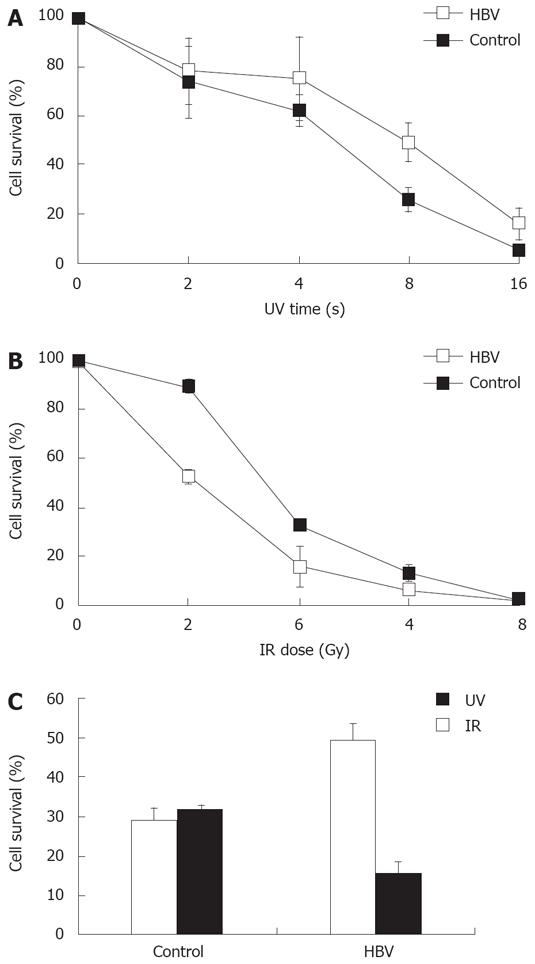
Figure 3 HBV infection hypersensitizes host cells to IR and causes hyper-resistance of host cells to UV.
A: HL7702 cells were treated with indicated doses of IR followed HBV positive serum addition for 24 h, and continued in culture for another 4 d, trypan blue staining was used for viable cell counting; B: HL7702 cells were treated with indicated doses of UV followed by HBV-positive serum addition for 24 h, and continued culture for another 48 h, trypan blue staining was used for viable cell counting; C: HL7702 cells were treated with 8 s of UV or 4 Gy of IR followed HBV infection, and viable cells were counted. Percentage survival was determined by the number of treated cells normalized to untreated cells. Mean and standard error are presented for three independent experiments.
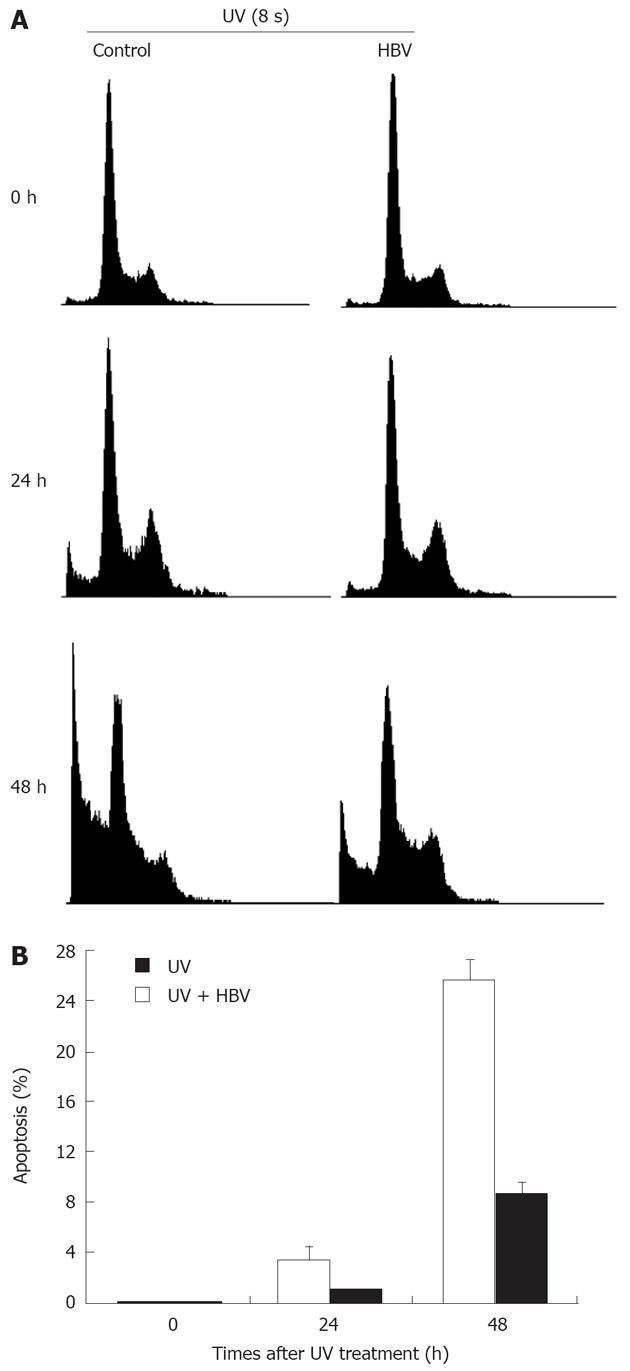
Figure 4 HBV infection followed by UV radiation led to decreased cell apoptosis.
A: HBV-positive serum was added to the culture medium before UV radiation treatment. Cells were washed extensively 24 h after HBV-positive serum addition and then treated with 8 s of UV radiation. Cell cycle profile was examined by propidium iodide staining and flow cytometry at indicated times after UV treatment; B: Apoptosis percentage after UV radiation followed HBV infection. Mean and standard error are presented for three independent experiments.
- Citation: Zhao F, Hou NB, Yang XL, He X, Liu Y, Zhang YH, Wei CW, Song T, Li L, Ma QJ, Zhong H. Ataxia telangiectasia-mutated-Rad3-related DNA damage checkpoint signaling pathway triggered by hepatitis B virus infection. World J Gastroenterol 2008; 14(40): 6163-6170
- URL: https://www.wjgnet.com/1007-9327/full/v14/i40/6163.htm
- DOI: https://dx.doi.org/10.3748/wjg.14.6163


