Copyright
©2008 The WJG Press and Baishideng.
World J Gastroenterol. Jan 28, 2008; 14(4): 617-621
Published online Jan 28, 2008. doi: 10.3748/wjg.14.617
Published online Jan 28, 2008. doi: 10.3748/wjg.14.617
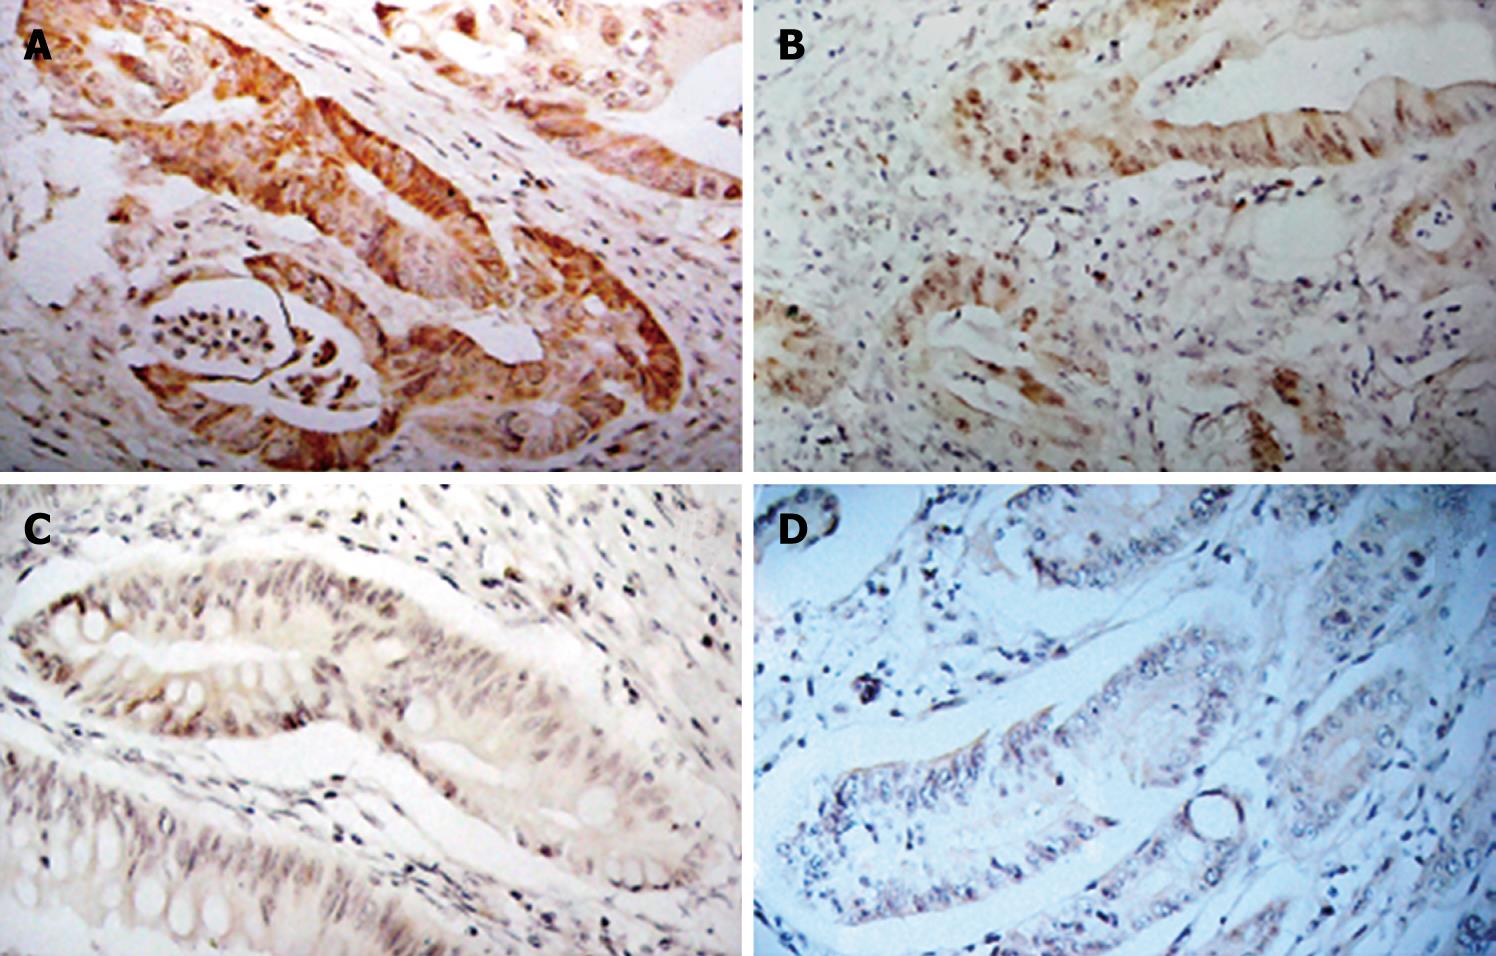
Figure 1 Immunohistochemical detection of TS staining intensity on paraffin sections of colorectal carcinoma.
A: Strong; B: moderate; C: Weak; D: Absent (× 200).
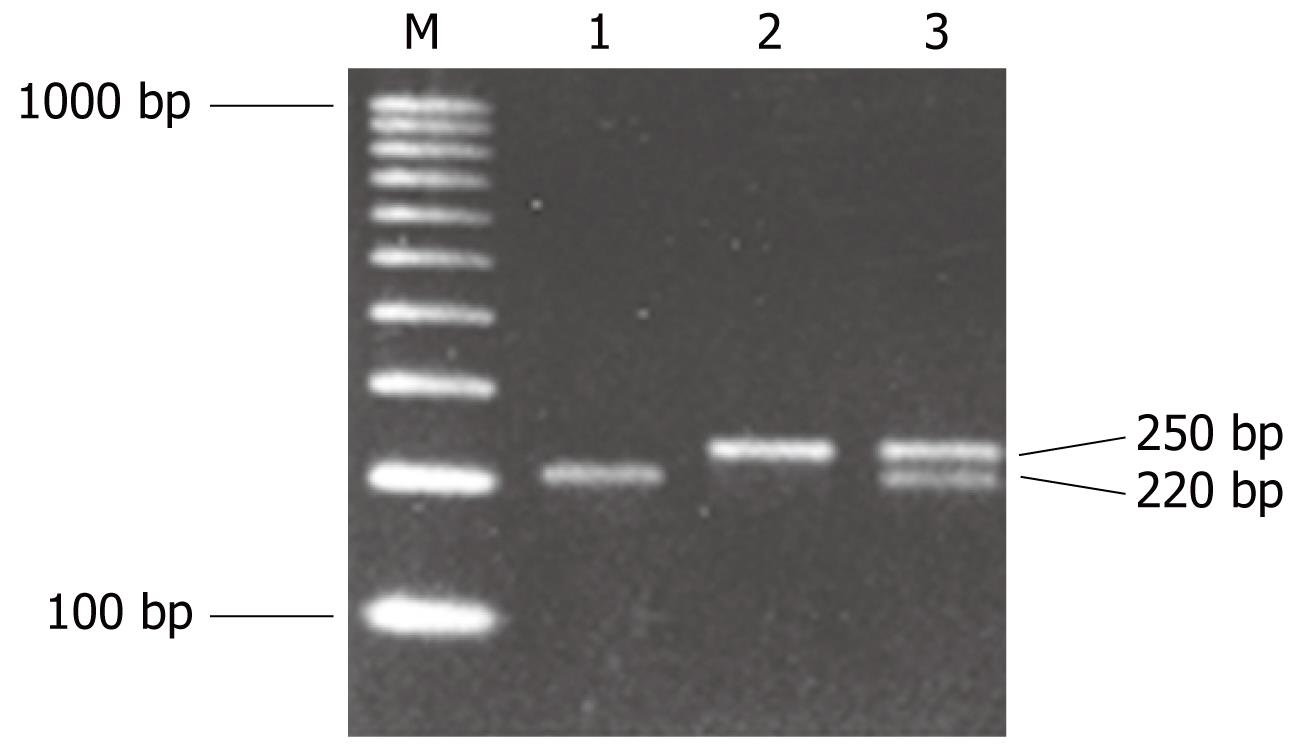
Figure 2 Electrophoresis of amplified products of patients with different TS TR genotypes: 220 bp (2R/2R), 248 bp (3R/3R) or both (2R/3R).
Lane 1: 220 bp (2R/2R); Lane 2: 248 bp (3R/3R); Lane 3: 220 bp and 248 bp (2R/3R); M: molecular weight marker, a 100 bp ladder.
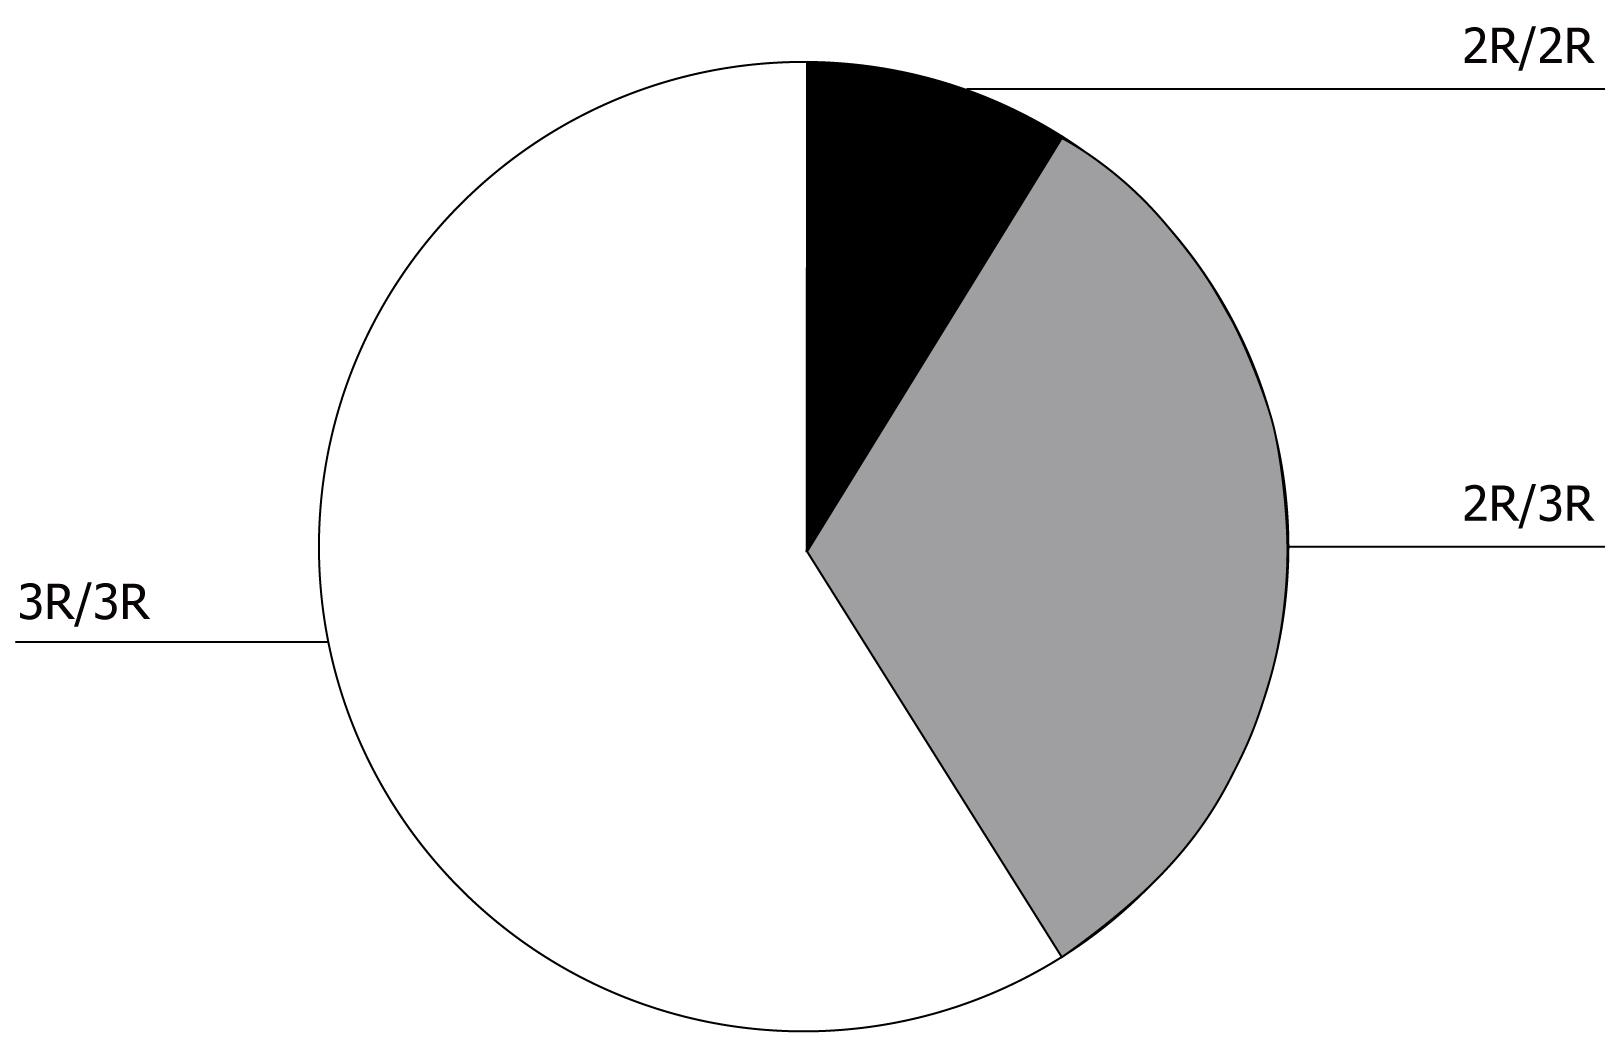
Figure 3 Distribution of TS polymorphisms.
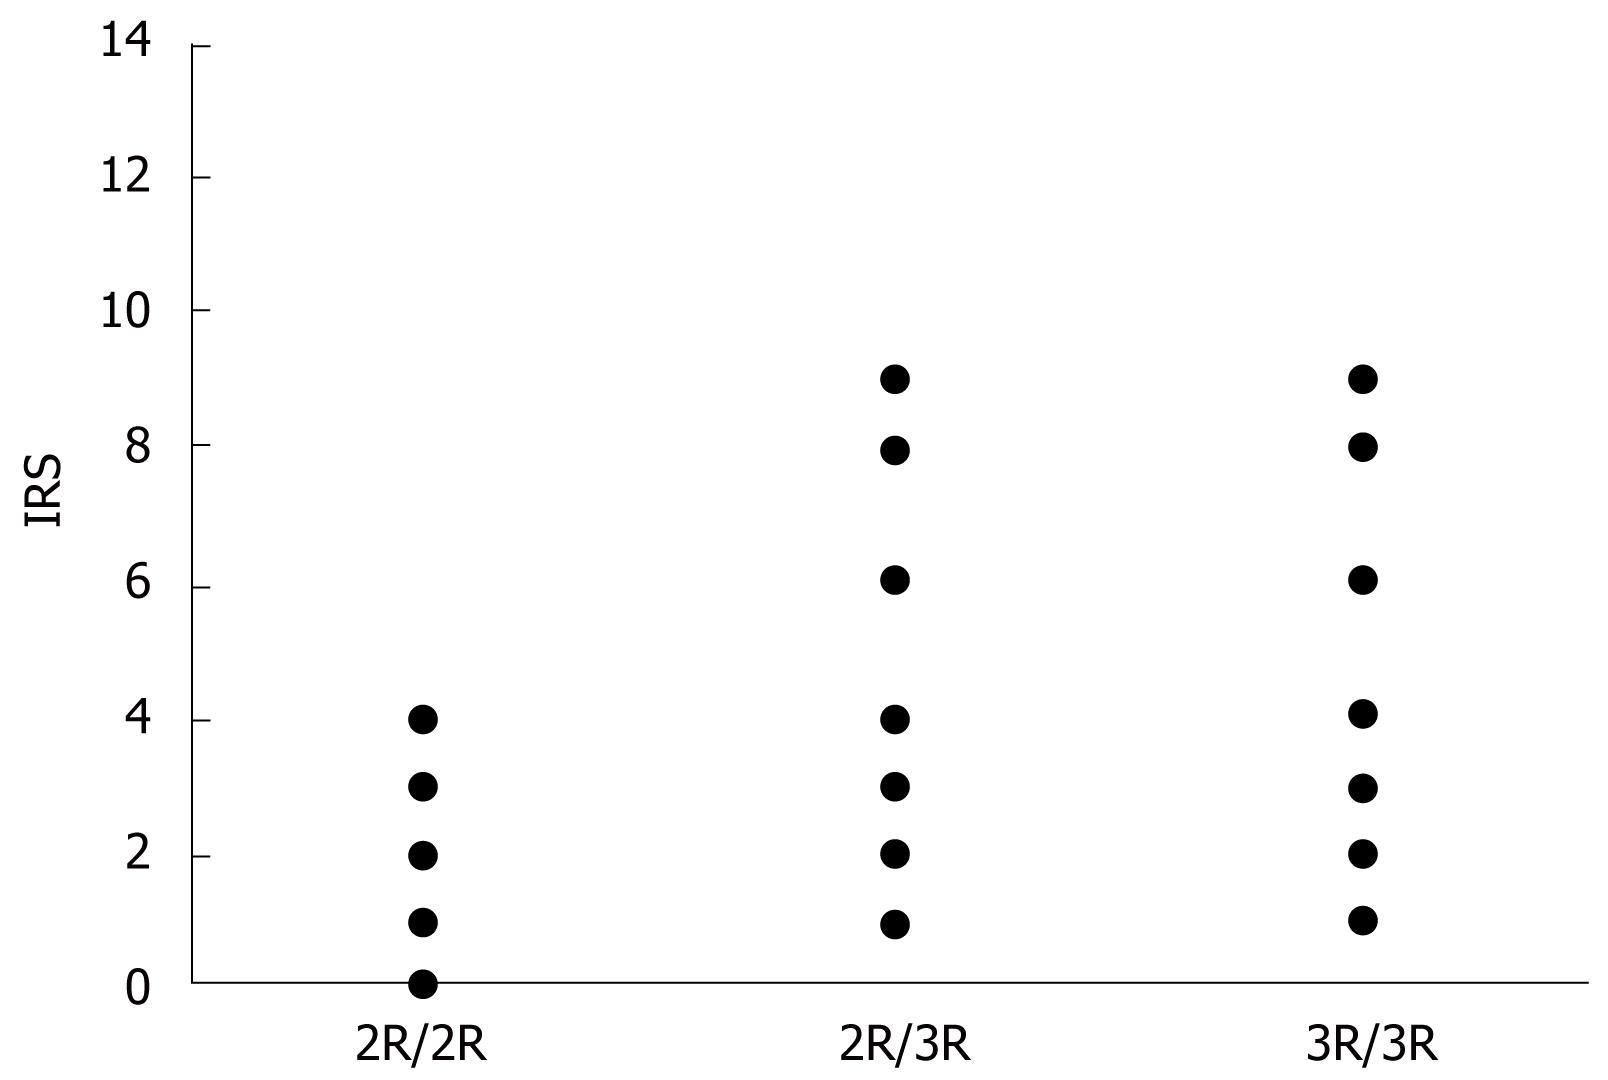
Figure 4 Association of TS genotype with IRS of TS.
IRS: Immunoreactivity score; TS: Thymidylate synthase.
- Citation: Yu KH, Wang WX, Ding YM, Li H, Wang ZS. Polymorphism of thymidylate synthase gene associated with its protein expression in human colon cancer. World J Gastroenterol 2008; 14(4): 617-621
- URL: https://www.wjgnet.com/1007-9327/full/v14/i4/617.htm
- DOI: https://dx.doi.org/10.3748/wjg.14.617


