Copyright
©2008 The WJG Press and Baishideng.
World J Gastroenterol. Jan 28, 2008; 14(4): 582-589
Published online Jan 28, 2008. doi: 10.3748/wjg.14.582
Published online Jan 28, 2008. doi: 10.3748/wjg.14.582
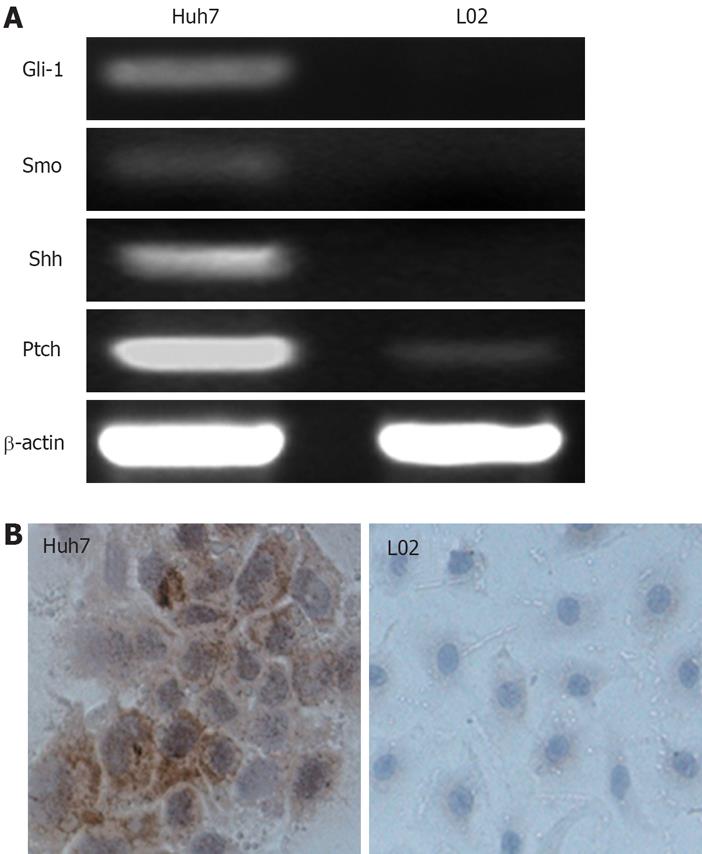
Figure 1 Expressions of Hh pathway components on Huh7 and L02 cells.
A: The expressions of Gli-1, Smo and Shh mRNA was observed in Huh cells, but not in L02 cells; Ptch mRNA was detected in both cell lines, but the expressions was elevated in Huh7 cells; B: Immunocytochemical staining showed Gli-1 protein expression in the cytoplasm of Huh7 cells, but not L02 cells.
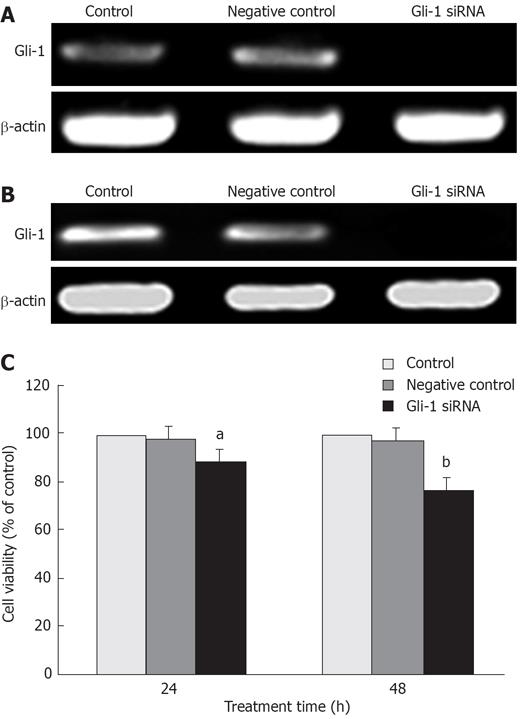
Figure 2 The effect of Gli-1 siRNA on cell viability in Huh7 cells.
A: The expressions of Gli-1 mRNA 24 h after transfection with Gli-1 siRNA analyzed by RT-PCR. Gli-1 mRNA expressions were significantly down-regulated; B: The expressions of Gli-1 mRNA 48 h after transfection with Gli-1 siRNA analyzed by RT-PCR; C: The effect of Gli-1 siRNA on Huh7 cell viability by MTT assay. Cells were treated with Gli-1 siRNA for indicated time. Data are expressed as the mean ± SD of 3 independent experiments (aP < 0.05 , bP < 0.01 ; vs control).
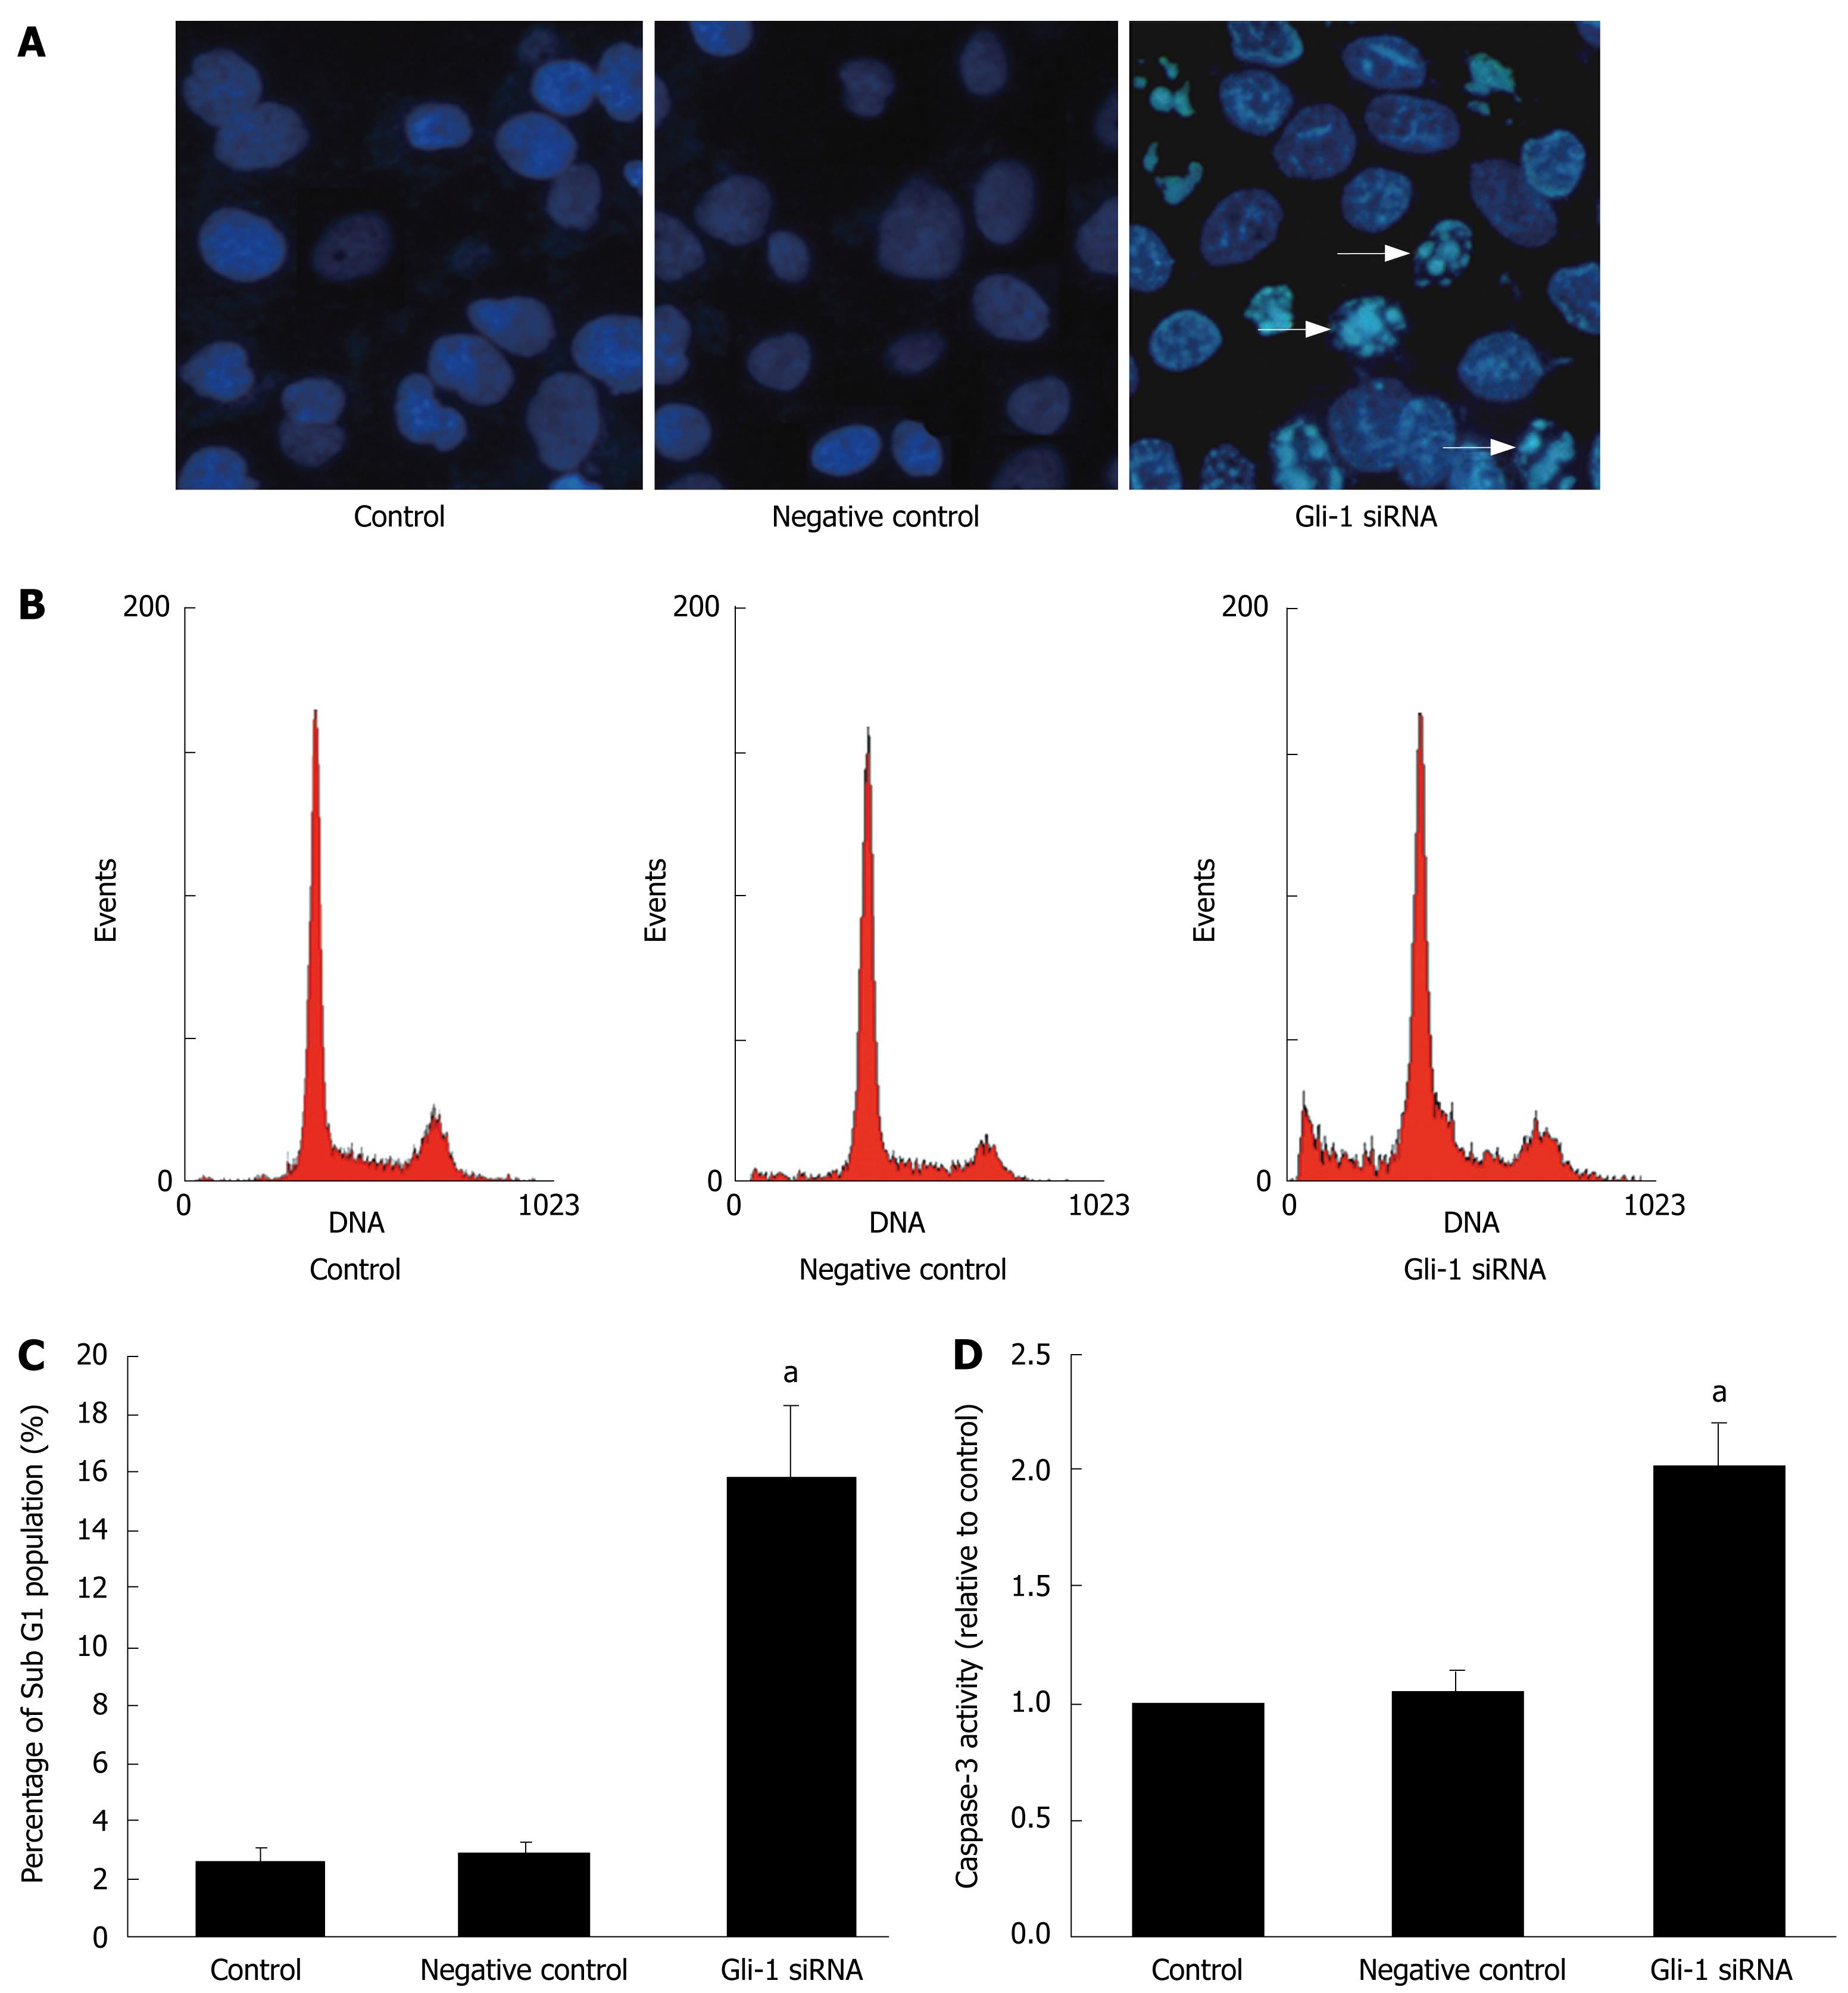
Figure 3 Gli-1 siRNA induced apoptosis in Huh7 cells.
Huh7 cells were treated with Gli-1 siRNA for 48 h. A: Morphologic changes characteristic of apoptosis. The samples were stained with Hoechst 33 258 (5 mg/L) for 10 min and photographed using fluorescence microscopy; B: Gli-1 SiRNA induced apoptosis as measured by propidium iodide using a flow cytometry analysis. After treatment, the nuclei were stained with propidium iodide and analyzed by flow cytometry. Representative frequency distributions of DNA content of cells in the three treatment groups were shown; C: The bar chart showed the percentage of cells in the sub-G1 apoptotic fraction. The treatment groups were labeled on the horizontal axis. The error bars represented the standard deviation; D: Gli-1 siRNA induced activation of caspase-3. The activity of caspase-3 was assessed by caspase colorimetric assay. The data were showed as mean ± SD of 3 independent experiments. (aP < 0.05 vs control).
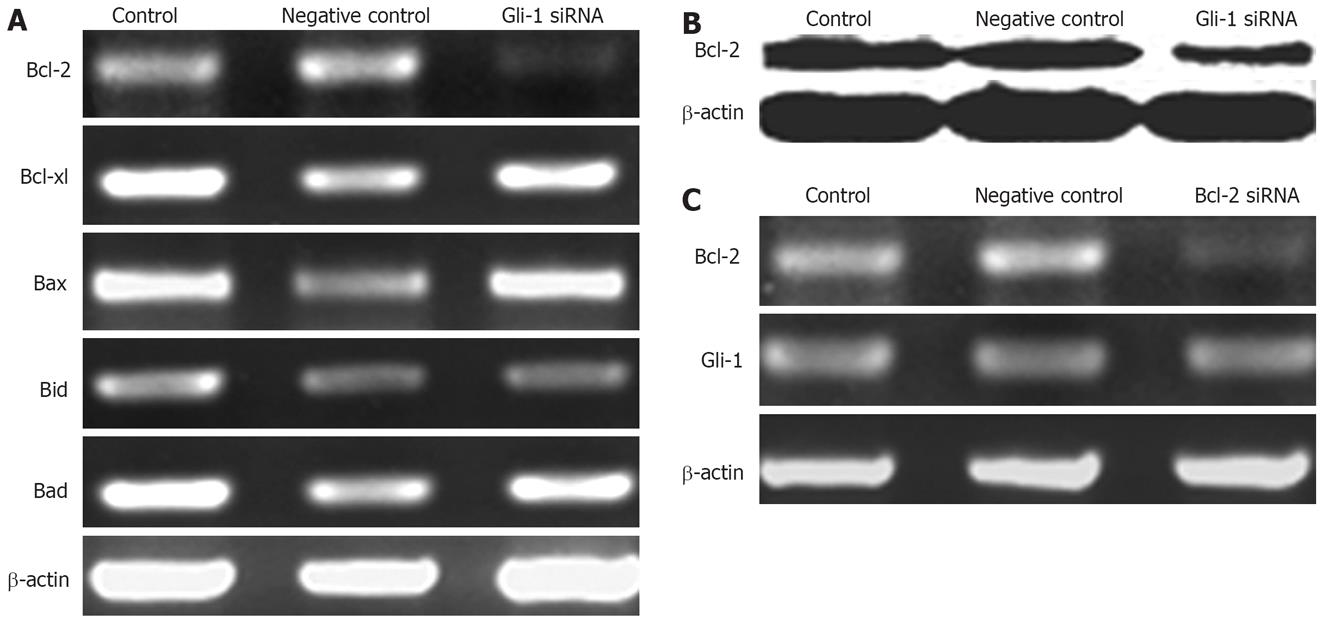
Figure 4 Effects of Gli-1 siRNA on Bcl-2 family member expressions in Huh7 cells.
A: The expressions of Bcl-2 family member mRNA 24 h after transfection with Gli-1 siRNA analyzed by RT-PCR. The expression of Bcl-2 was remarkably decreased, but no change for other members; B: The protein of Bcl-2 was detected by Western blot. The Bcl-2 protein was markedly decreased after 24 h treatment with Gli-1 siRNA; C: Bcl-2 siRNA effectively inhibited the expressions of Bcl-2, but the mRNA of Gli-1 was no change after transfection with Bcl-2 siRNA.
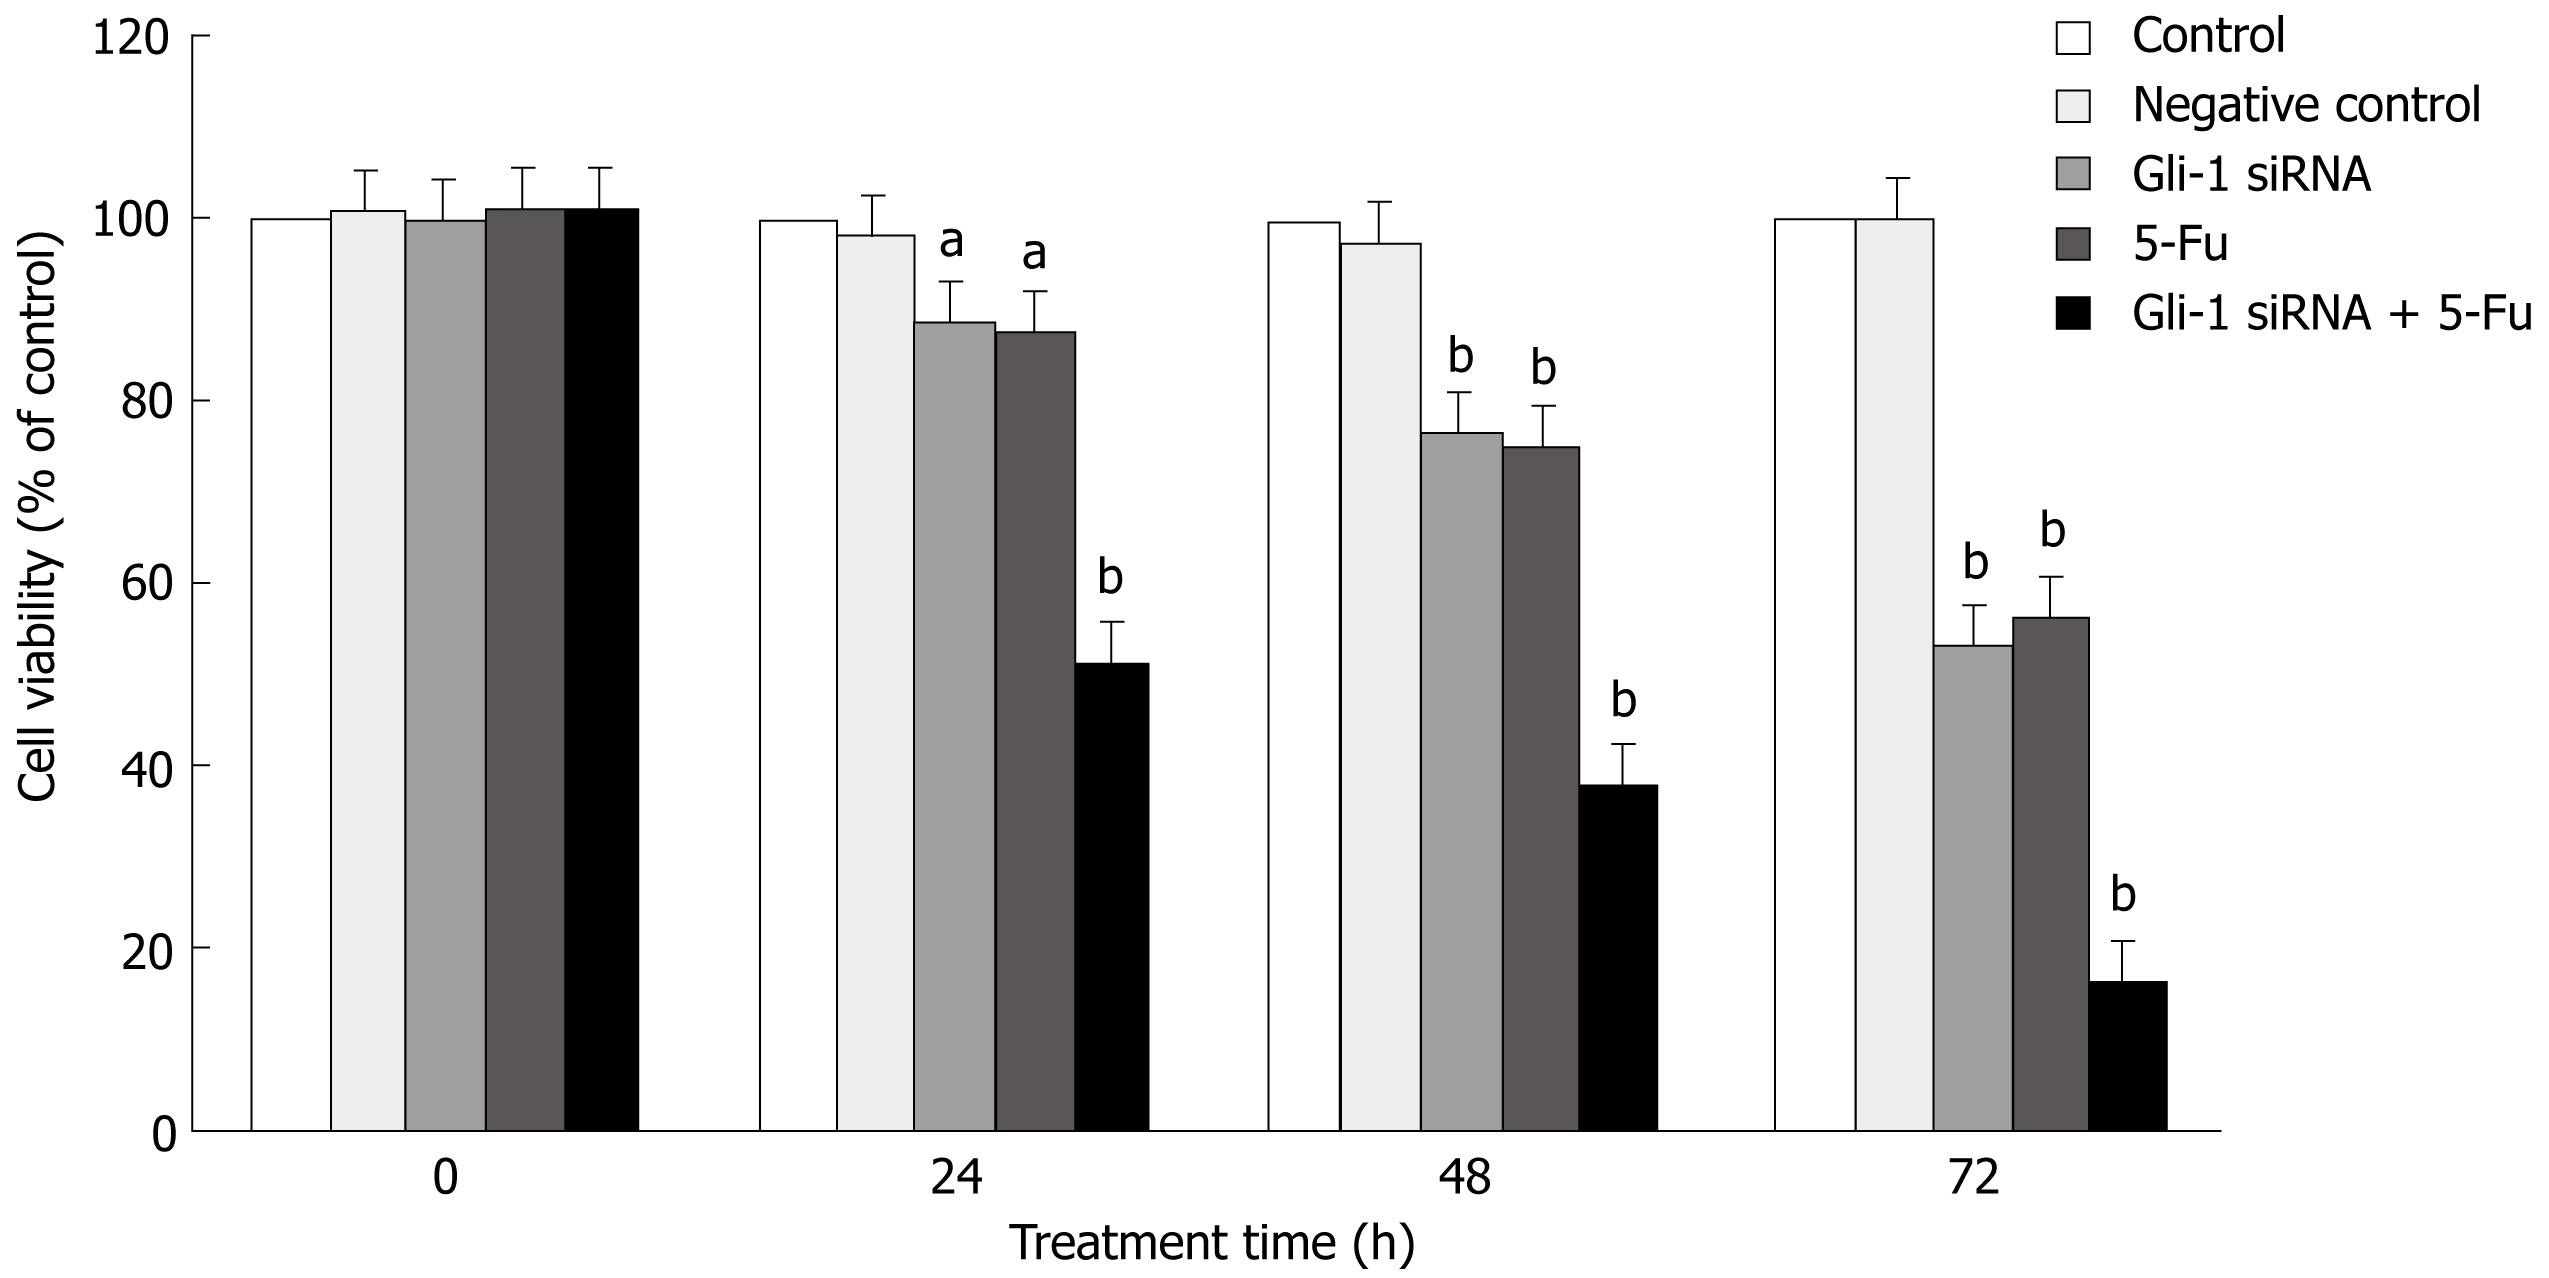
Figure 5 Effect of Gli-1 siRNA combining with 5-Fu on Huh7 cells.
The effect of Gli-1 siRNA combining with 5-Fu on Huh7 cell viability was measured by MTT assay. Cells were transfected with Gli-1 siRNA. After 6 h, cells were exposed to 5-Fu (25 &mgr;mol/L) or not for the indicated time periods. The bars are grouped according to the treatment time as labeled below the horizontal axis. The treatment groups were as labeled on the color key. Data are expressed as the mean ± SD of 3 independent experiments (aP < 0.05 ; bP < 0.01 vs control or negative control).
- Citation: Chen XL, Cao LQ, She MR, Wang Q, Huang XH, Fu XH. Gli-1 siRNA induced apoptosis in Huh7 cells. World J Gastroenterol 2008; 14(4): 582-589
- URL: https://www.wjgnet.com/1007-9327/full/v14/i4/582.htm
- DOI: https://dx.doi.org/10.3748/wjg.14.582


