Copyright
©2008 The WJG Press and Baishideng.
World J Gastroenterol. Jan 28, 2008; 14(4): 554-562
Published online Jan 28, 2008. doi: 10.3748/wjg.14.554
Published online Jan 28, 2008. doi: 10.3748/wjg.14.554
Figure 1 Detection of phosphorylated ERK1/2 in transfected AGS cells.
Cells transfected with WT-cagA or blank vectors were stimulated with serum by adding fresh medium containing 10% FCS for 0, 1 and 3 h, after 24 h serum starvation, and then harvested for Western blot analysis of total and phosphorylated ERK1/2 (P-ERK1/2). The level of P-ERK1/2 in WT-cagA transfectants was significantly higher than that in blank vector transfectants and untransfected AGS cells at all three time points of serum stimulation. No obvious increases in total ERK among the three groups were found. GAPDH level was used as a loading control.
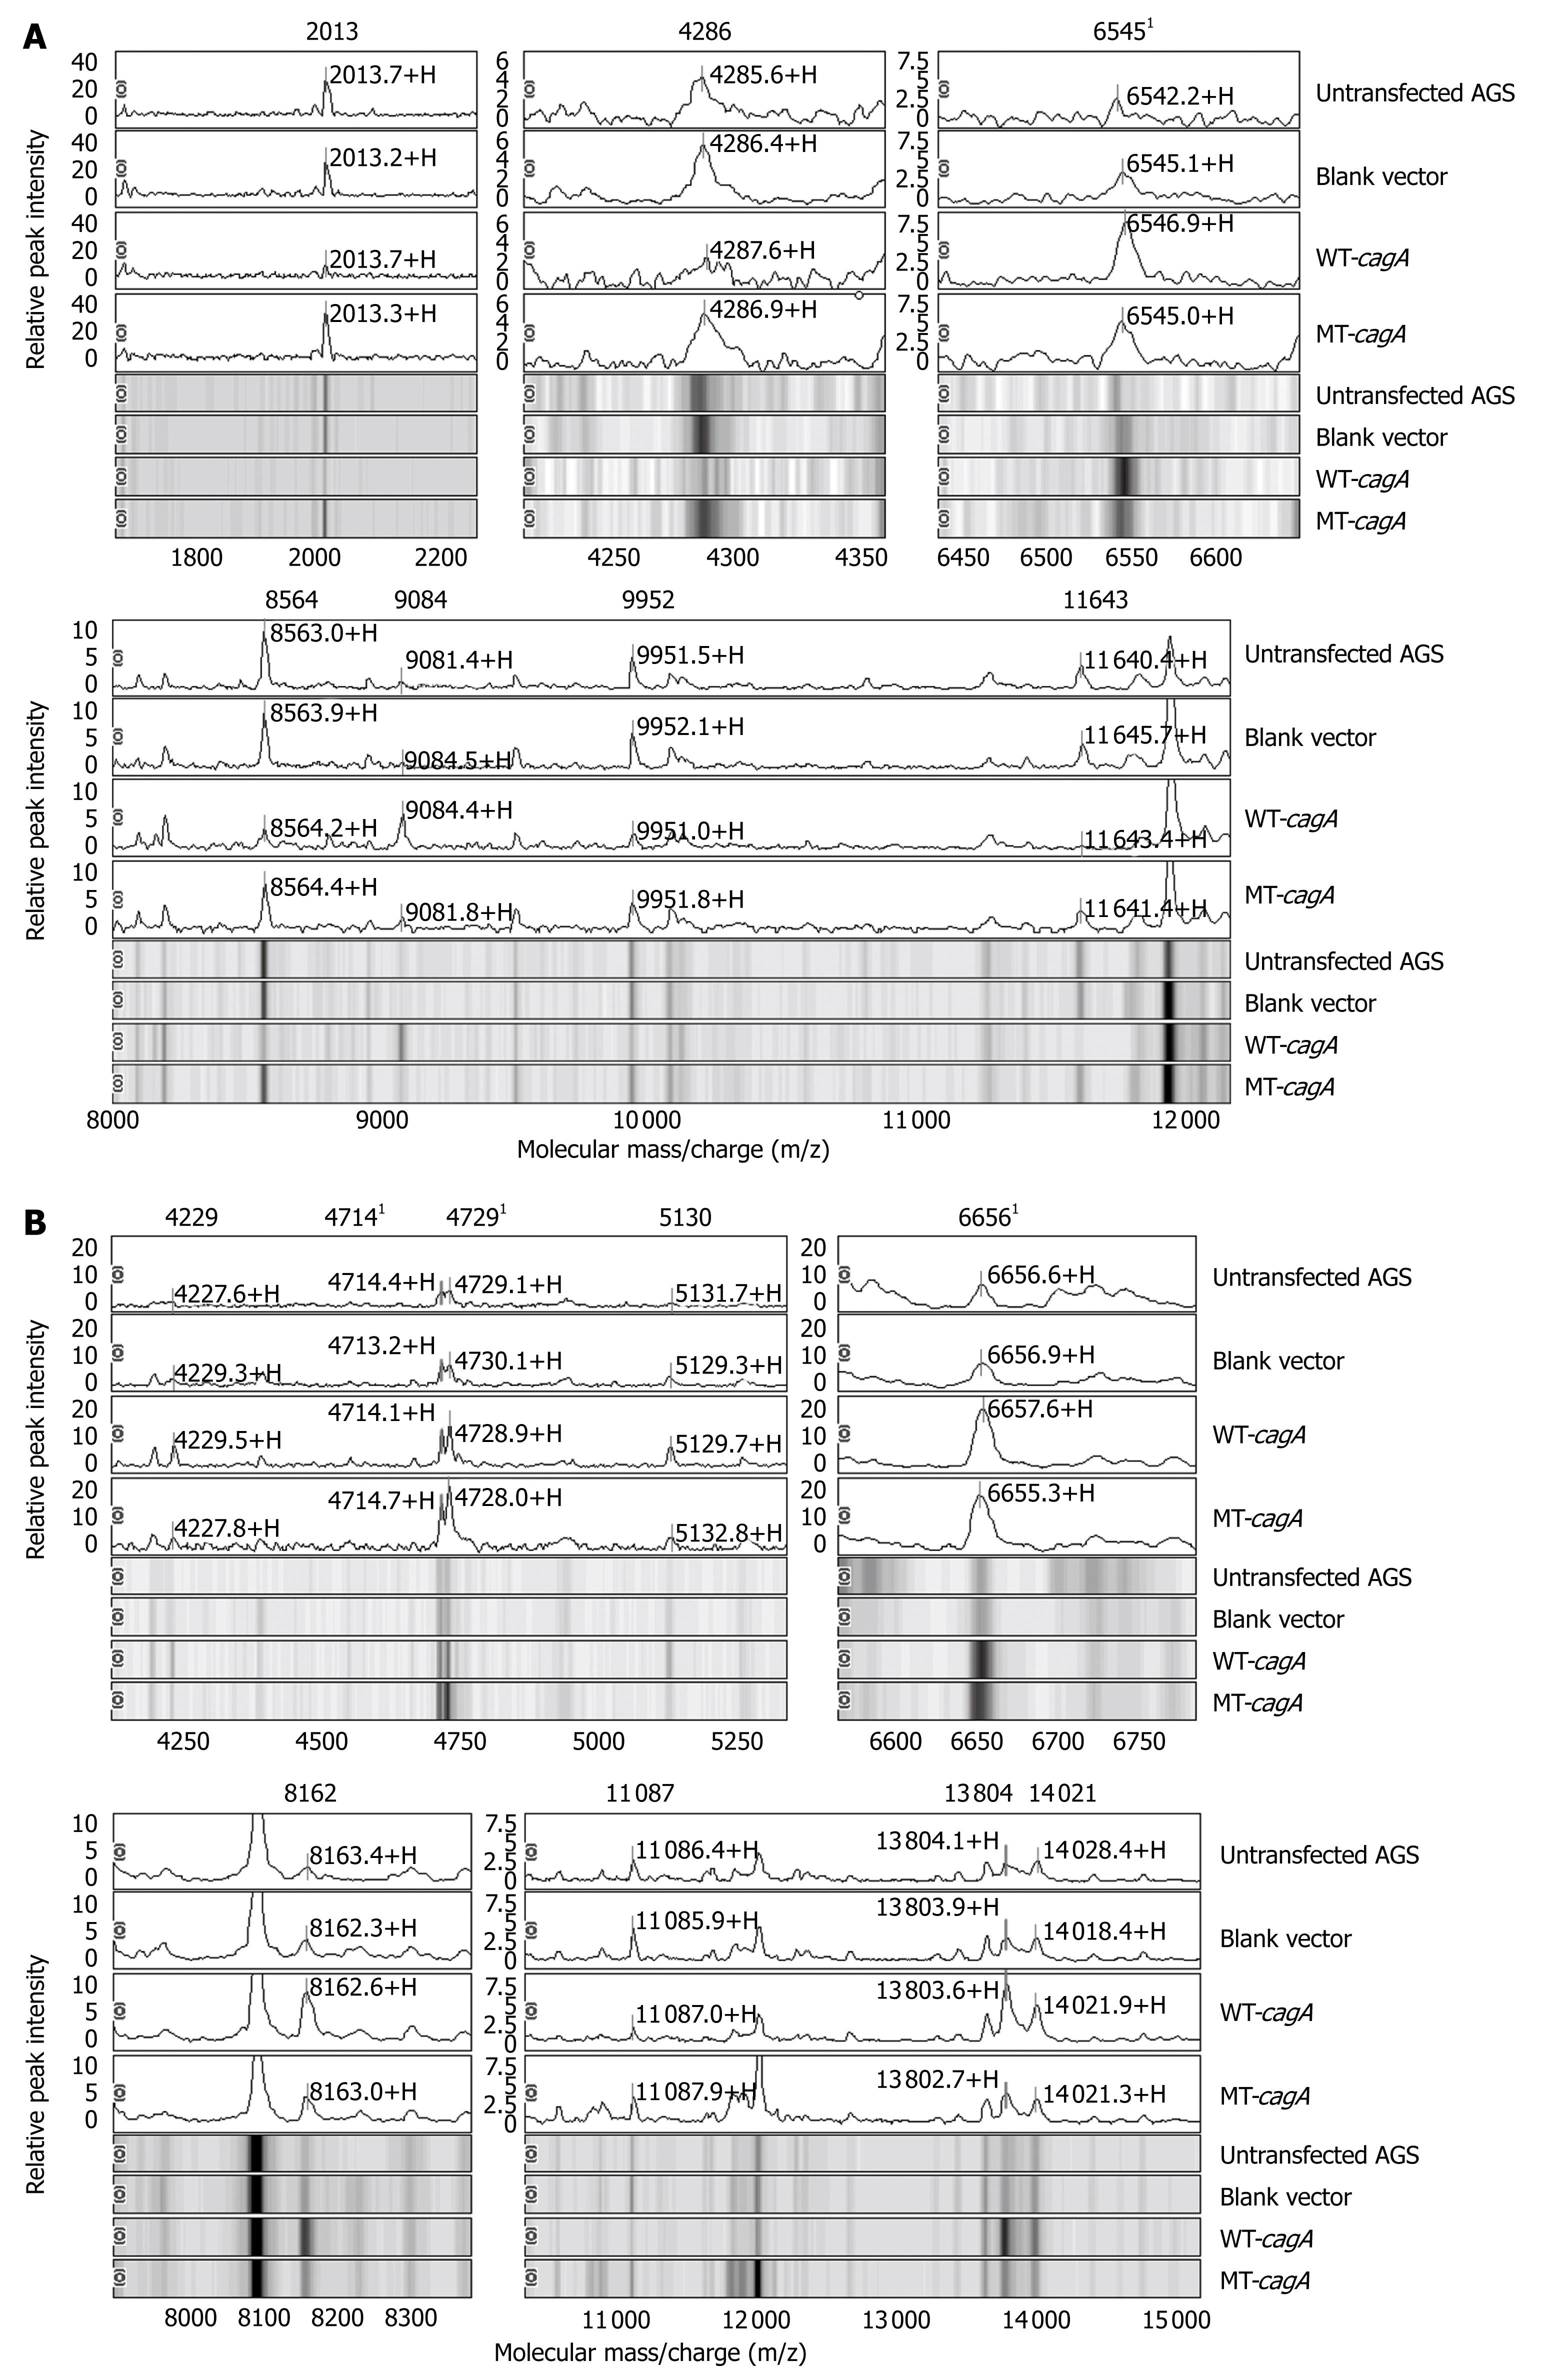
Figure 2 Biomarker proteins with different expression level in WT-cagA, phosphorylation site mutant cagA (MT-cagA) and blank-vector-transfected AGS cells detected by ProteinChip arrays.
Cell lysates of each group were analyzed on SAX2 and CM10 Chip surfaces under laser intensity of 180 and sensitivity of 7. One representative spectrum was selected from a quadruplicate set of samples for each group. The top panel in each figure is the spectral view, and the lower panel is the gel view. Peaks with different expression level were marked with m/z values. A: Biomarkers detected by SAX2; B: Biomarkers detected by CM10. 1Indicates CagA tyrosine-phosphorylation-independent proteins, which can be induced by both WT CagA and MT CagA (adopted from Chinese J Cell Biology 2006; 28: 603-610).
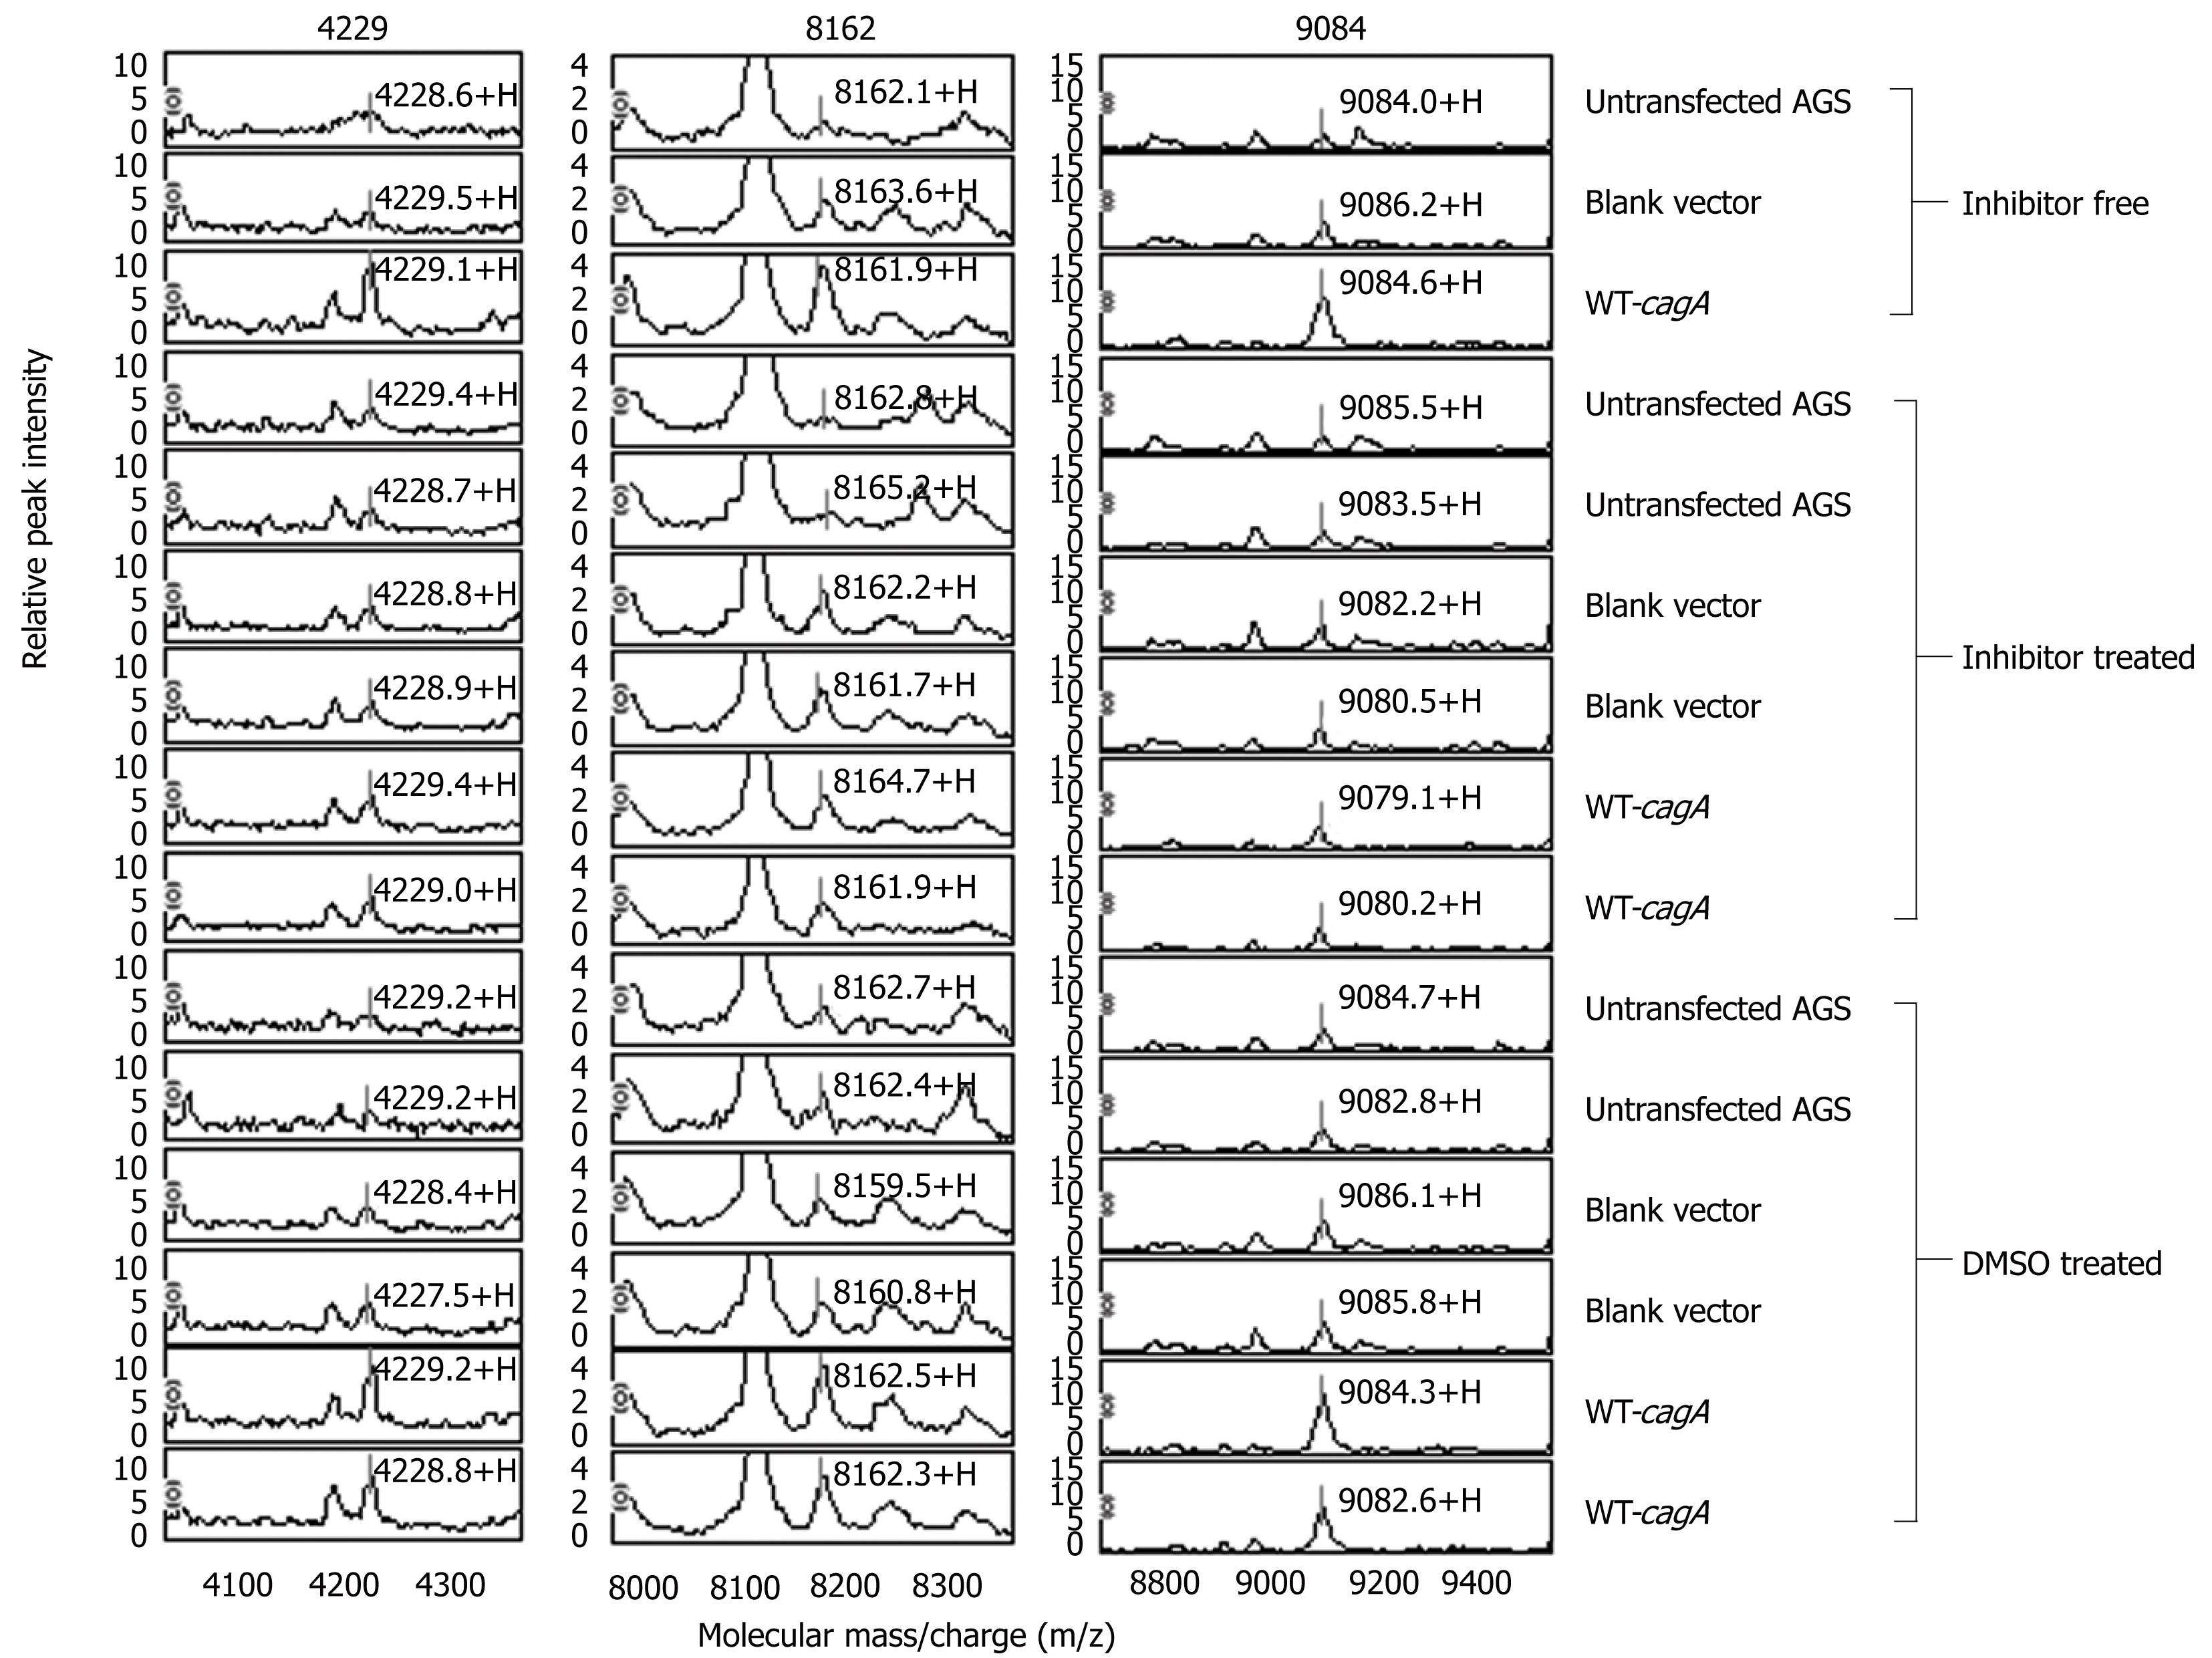
Figure 3 Expression differences of biomarker proteins caused by ERK pathway activation.
Cells were transfected with WT-cagA or blank vectors with treatment of MEK inhibitor U0126, or its vehicle DMSO. Expression differences of three biomarkers with m/z 4229 (CM10), 8162 (CM10) and 9084 (SAX2) between WT-cagA transfectants and vector transfectants appeared under both MEK-inhibitor-free and DMSO-treated conditions, but disappeared under inhibitor-treated conditions.
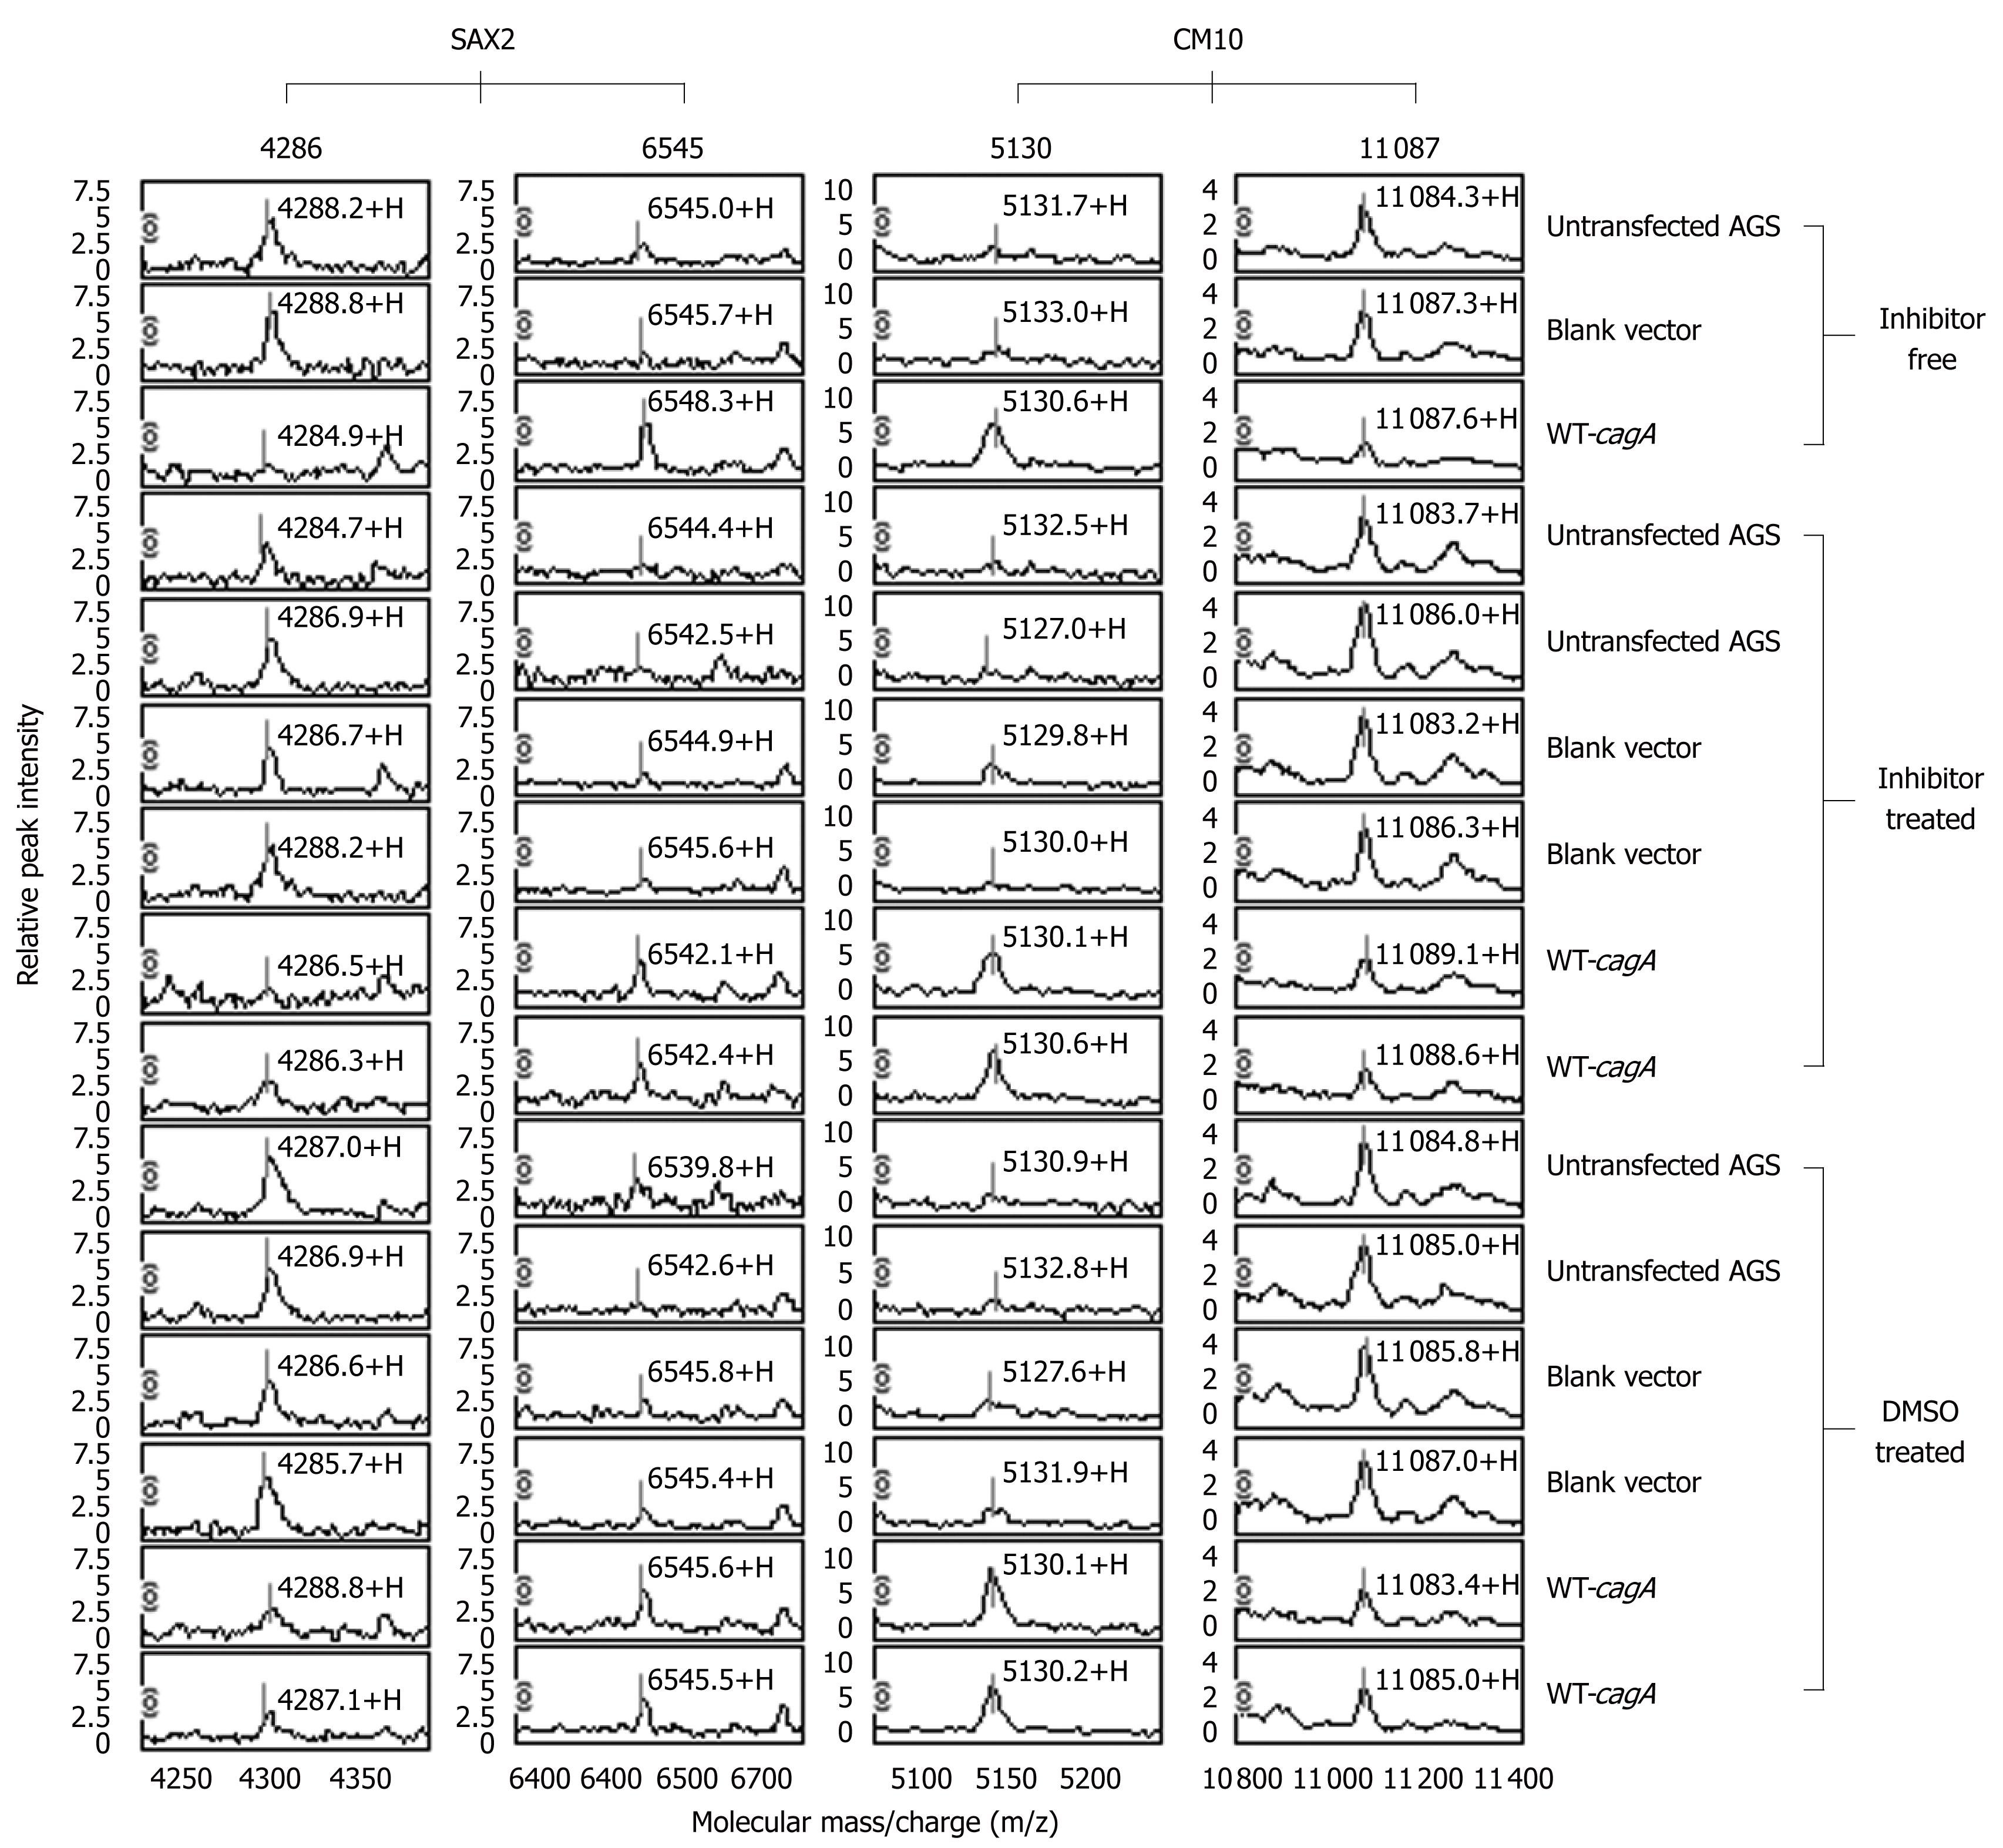
Figure 4 Expression differences of biomarker proteins not caused by ERK pathway activation.
Expression differences of the other 13 biomarker proteins between WT-cagA transfectants and vector transfectants appeared not only under MEK-inhibitor-free and DMSO-treated conditions, but also under MEK-inhibitor-treated conditions. Spectra of typical biomarker proteins with m/z 4286 (SAX2), 6545 (SAX2), 5130 (CM10) and 11 087 (CM10) are shown in the figure.
- Citation: Ge Z, Zhu YL, Zhong X, Yu JK, Zheng S. Discovering differential protein expression caused by CagA-induced ERK pathway activation in AGS cells using the SELDI-ProteinChip platform. World J Gastroenterol 2008; 14(4): 554-562
- URL: https://www.wjgnet.com/1007-9327/full/v14/i4/554.htm
- DOI: https://dx.doi.org/10.3748/wjg.14.554


