Copyright
©2008 The WJG Press and Baishideng.
World J Gastroenterol. Oct 21, 2008; 14(39): 6004-6011
Published online Oct 21, 2008. doi: 10.3748/wjg.14.6004
Published online Oct 21, 2008. doi: 10.3748/wjg.14.6004
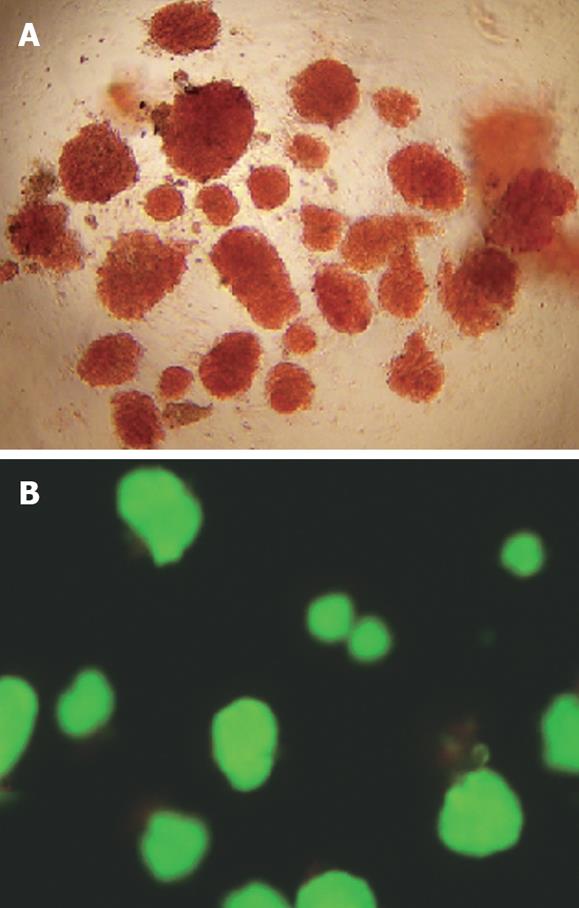
Figure 1 Quality assessment of freshly isolated islets.
A: DTZ staining of islets under an inverted microscope (× 10); B: AO/PI double fluorescence staining of islets under a fluorescent microscopy (× 10).
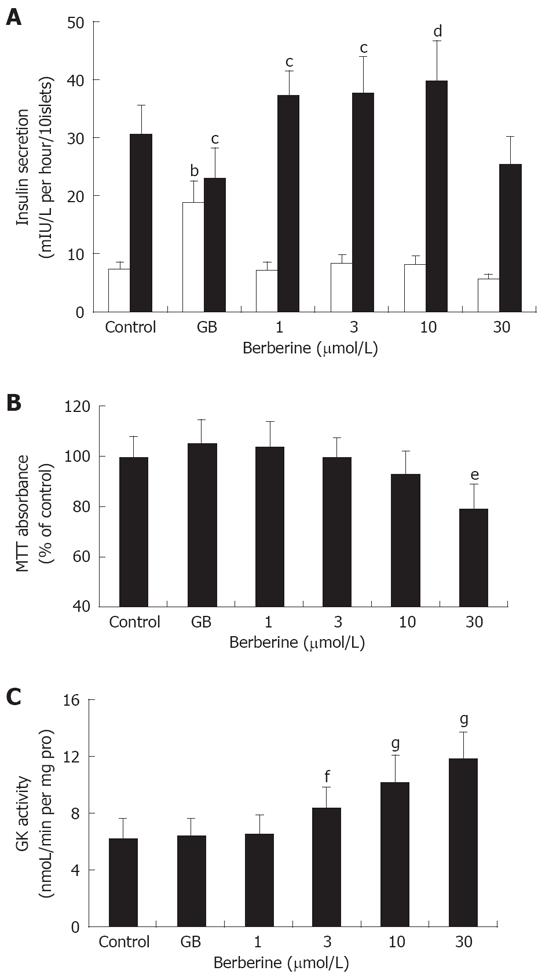
Figure 2 Pharmacological effects of berberine and GB on pancreatic islets.
A: Effects of berberine and GB on basal (2.8 mmol/L Glucose) and GSIS (16.7 mmol/L Glucose) by pancreatic islets. Control and GB represent islets of untreated and 1 μmol/L GB treated groups, while 1, 3, 10 and 30 represent berberine groups of indicated concentrations. bP < 0.01 vs control at 2.8 mmol/L glucose; cP < 0.05, dP < 0.01 vs control at 16.7 mmol/L glucose; B: Cytotoxicity of berberine and GB on islet cells assessed by MTT assay. Results were expressed as the percentage of absorbance to the control value. Data are presented as mean ± SD (n = 6). eP< 0.01 vs control. C: Effects of berberine and GB on islet GK activity. fP < 0.05, gP < 0.01 vs control.
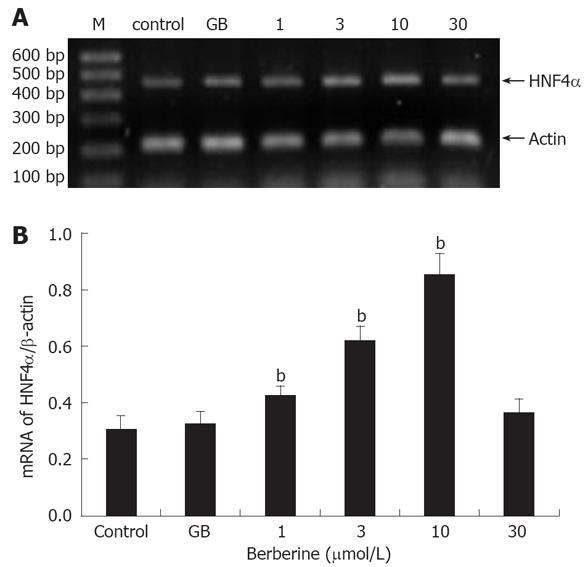
Figure 3 Effects of berberine and GB on HNF4α mRNA expression.
A: A representative gel electrophresis profile of DNA fragment; B: Semi-quantitative mRNA determination, results were normalized to β-actin and expressed as arbitrary unit. M: DNA Marker, control and GB represent islets of untreated and 1 μmol/L GB treated groups; 1, 3, 10 and 30 represent berberine groups of indicated concentrations. Data are presented as mean ± SD (n = 6), bP < 0.01 vs control.
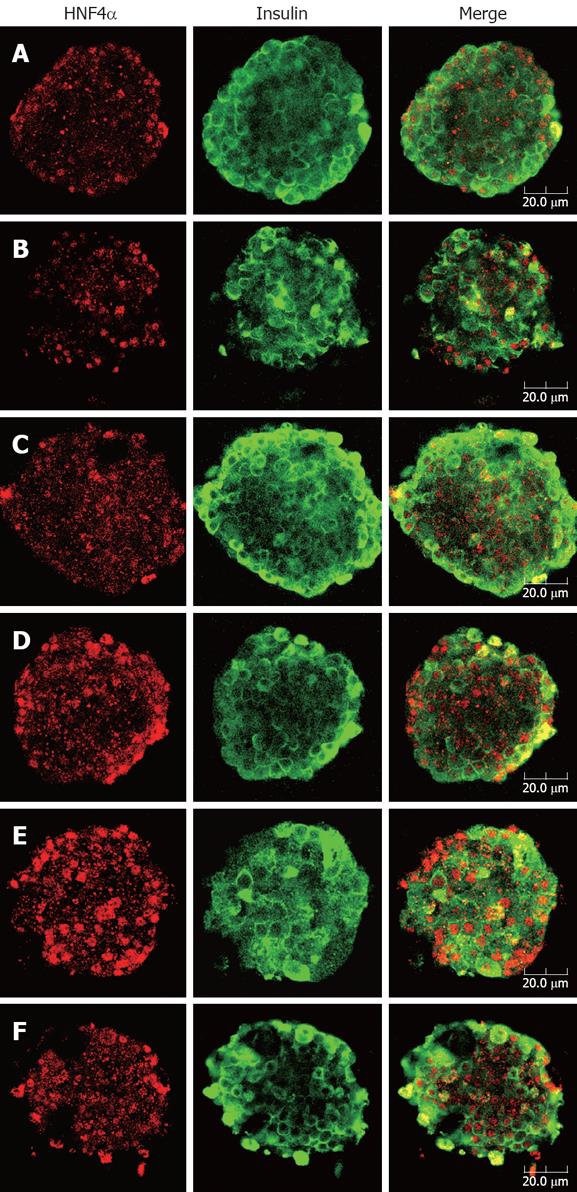
Figure 4 Double immunofluorescence staining for HNF4α (red) and insulin (green) of rat pancreatic islets.
After treatment with indicated concentrations of berberine or GB for 24 h, islets were fixed and stained with anti-HNF4α and anti-insulin antibodies. Images of islets were taken at the corresponding depth by confocal laser microscopy (× 40). A: Control, B: 1 μmol/L GB; C to F: Represent 1, 3, 10 and 30 μmol/L berberine. Bar in the figure indicates 20 μm. Apparent nuclear localization of HNF4α could be observed in all groups of islets, while insulin fluorescence was diffusely distributed in cytoplasma of β cells. In the islets treated with various concentrations of berberine, the red fluorescence emitted was comparatively intense, suggesting up-regulated expression of HNF4α, while no obvious difference of HNF4α staining was found between control and GB treated islets.
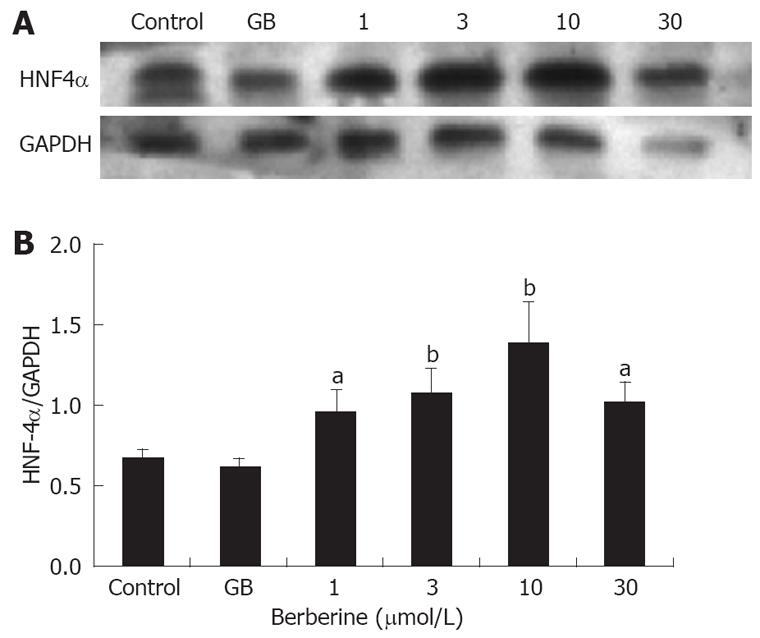
Figure 5 Effects of berberine and GB on protein expression of HNF4α.
A: A representative Western blot of HNF4α; B: Quantification of HNF4α protein, results were adjusted to GAPDH and expressed as relative density units. Control and GB represent islets of untreated and 1 μmol/L GB treated groups, 1, 3, 10 and 30 represent berberine groups of indicated concentrations. Data are presented as mean ± SD (n = 3). aP < 0.05, bP < 0.01 vs control.
- Citation: Wang ZQ, Lu FE, Leng SH, Fang XS, Chen G, Wang ZS, Dong LP, Yan ZQ. Facilitating effects of berberine on rat pancreatic islets through modulating hepatic nuclear factor 4 alpha expression and glucokinase activity. World J Gastroenterol 2008; 14(39): 6004-6011
- URL: https://www.wjgnet.com/1007-9327/full/v14/i39/6004.htm
- DOI: https://dx.doi.org/10.3748/wjg.14.6004


