Copyright
©2008 The WJG Press and Baishideng.
World J Gastroenterol. Oct 14, 2008; 14(38): 5857-5867
Published online Oct 14, 2008. doi: 10.3748/wjg.14.5857
Published online Oct 14, 2008. doi: 10.3748/wjg.14.5857
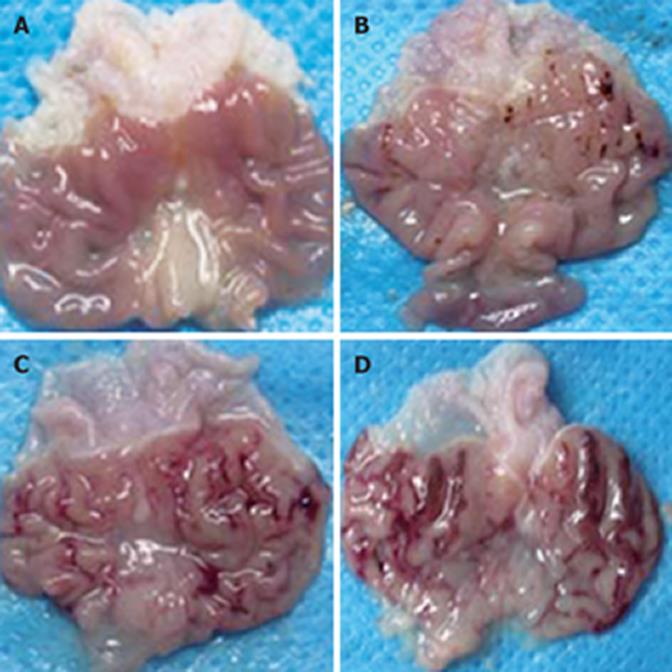
Figure 1 Gross appearance of gastric mucosa in rats with ethanol-induced acute gastric mucosa injury 2 h after administration of normal sodium (A), 40% (W/W) ethanol (B), 70% (W/W) ethanol (C), and 100% (W/W) ethanol (D), respectively.
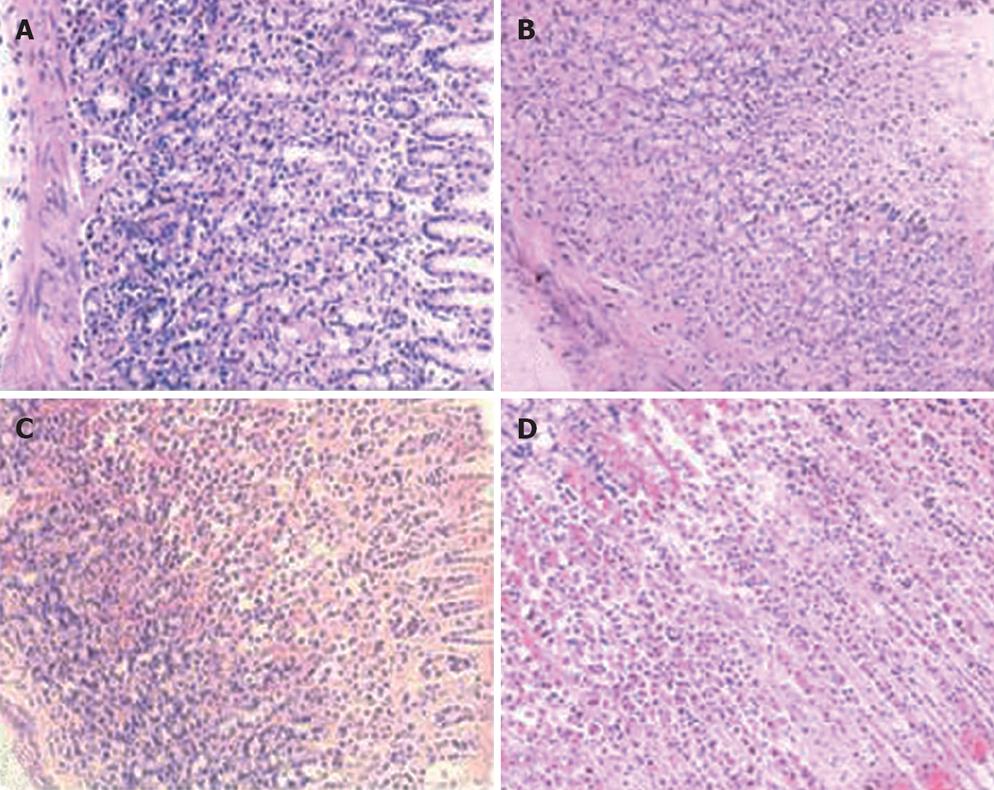
Figure 2 Histological changes in gastric mucosa of rats with ethanol-induced acute gastric mucosa injury (× 100) 2 h after administration of normal sodium (A), 40% (W/W) ethanol (B), 70% (W/W) ethanol (C), and 100% (W/W) ethanol (D), respectively.
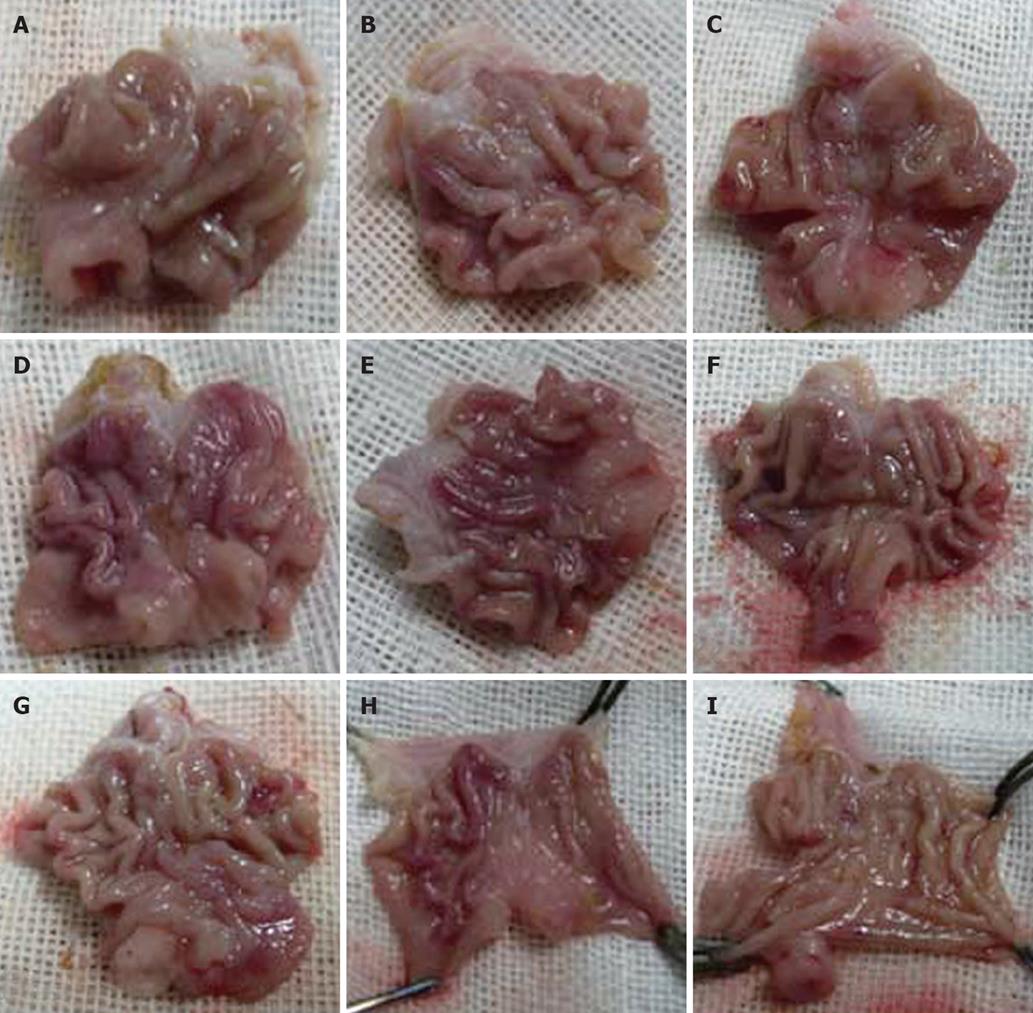
Figure 3 Gross changes in gastric mucosa of rats with ethanol-induced chronic gastric mucosa injury 3 wk after administration of normal sodium (A), 25% (W/W) ethanol (B), and 45% (W/W) ethanol (C), respectively; 6 wk after administration of normal sodium (D), 25% (W/W) ethanol (E), and 45% (W/W) ethanol (F), respectively; 9 wk after administration of normal sodium (G), 25% (W/W) ethanol (H), and 45% (W/W) ethanol (I), respectively.
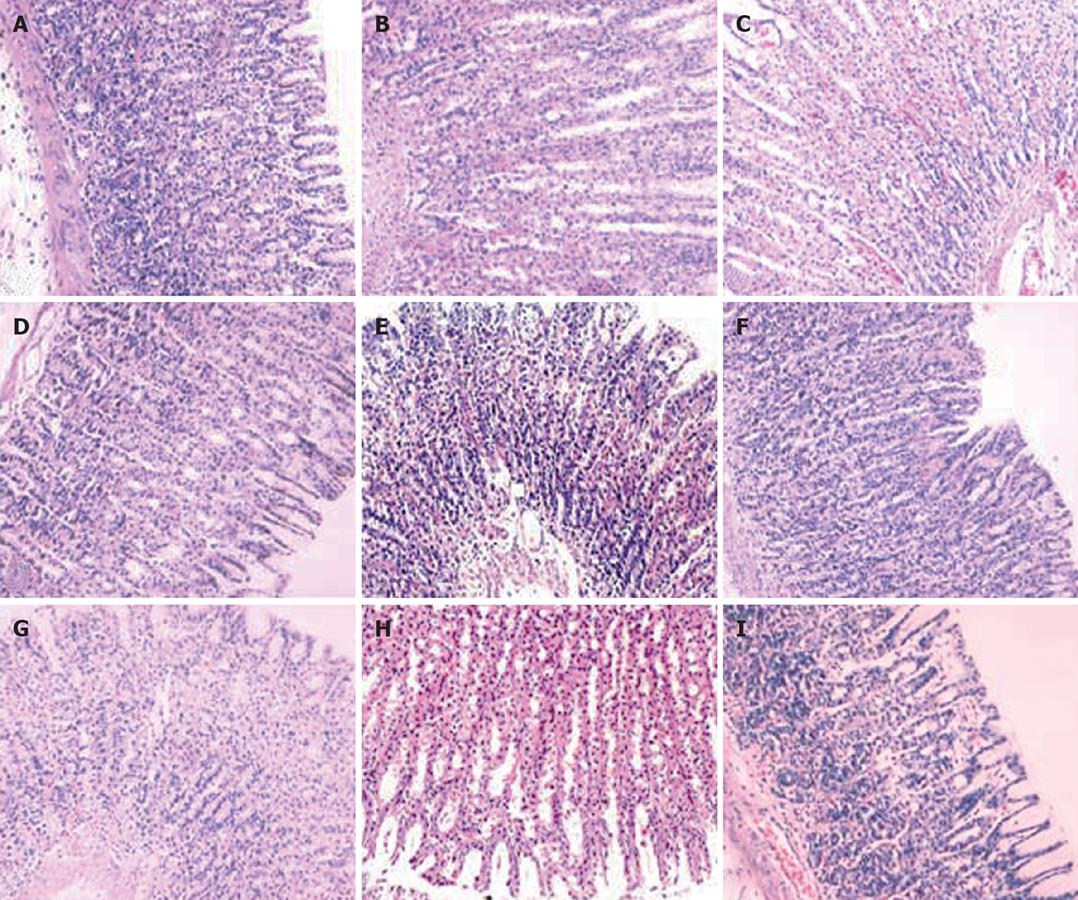
Figure 4 Histological changes in gastric mucosa of rats with ethanol-induced chronic gastric mucosa injury (HE stain) 3 wk after administration of normal sodium (A), 25% (W/W) ethanol (B), and 45% (W/W) ethanol (C), respectively; 6 wk after administration of normal sodium (D), 25% (W/W) ethanol (E), and 45% (W/W) ethanol (F), respectively; 9 wk after administration of normal sodium (G), 25% (W/W) ethanol (H), and 45% (W/W) ethanol (I), respectively.
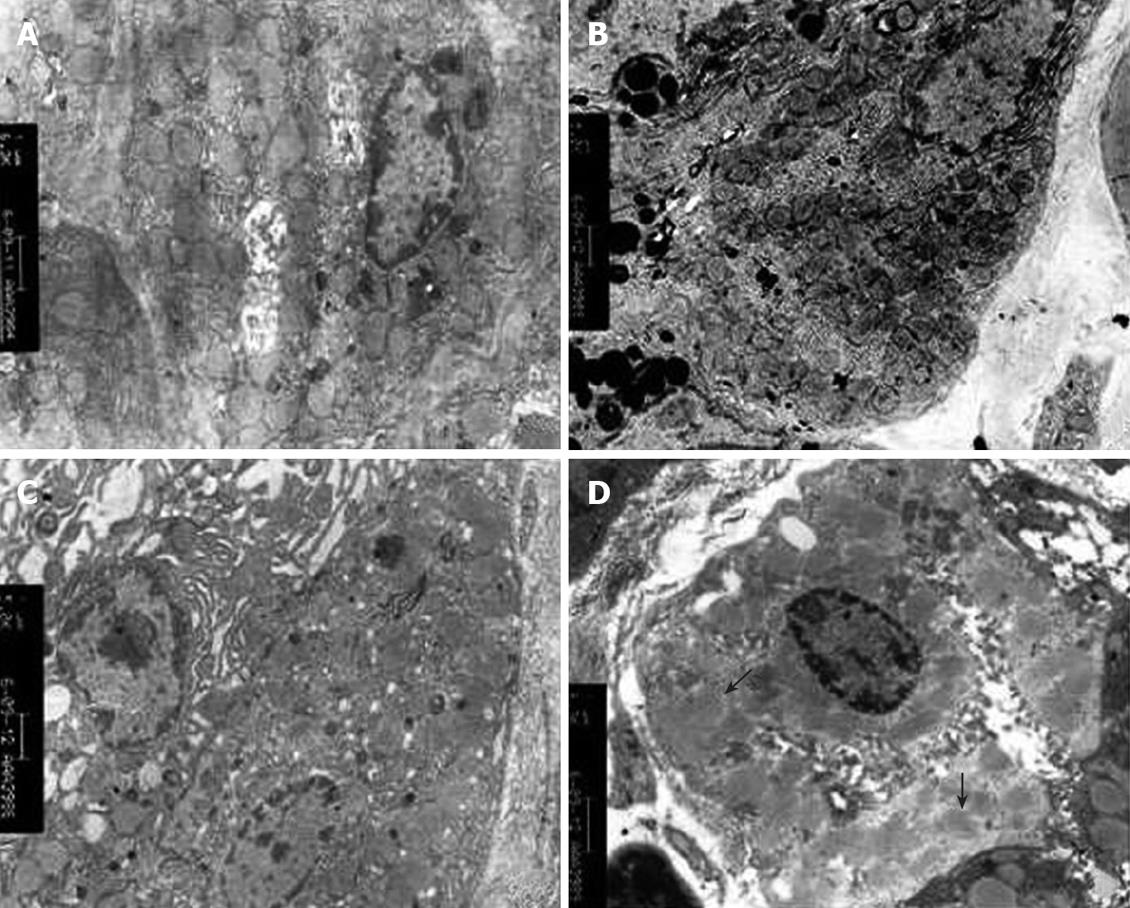
Figure 5 Changes in mitochondrial ultra-structure of rats with ethanol-induced acute gastric mucosa injury 2 h after administration of normal sodium (A), 40% (W/W) ethanol (B) 70% (W/W) ethanol (C), and 100% (W/W) ethanol (D), respectively.
Arrows indicate swollen and collapsed mitochondria and dissolved and diminished mitochondrial cristae.
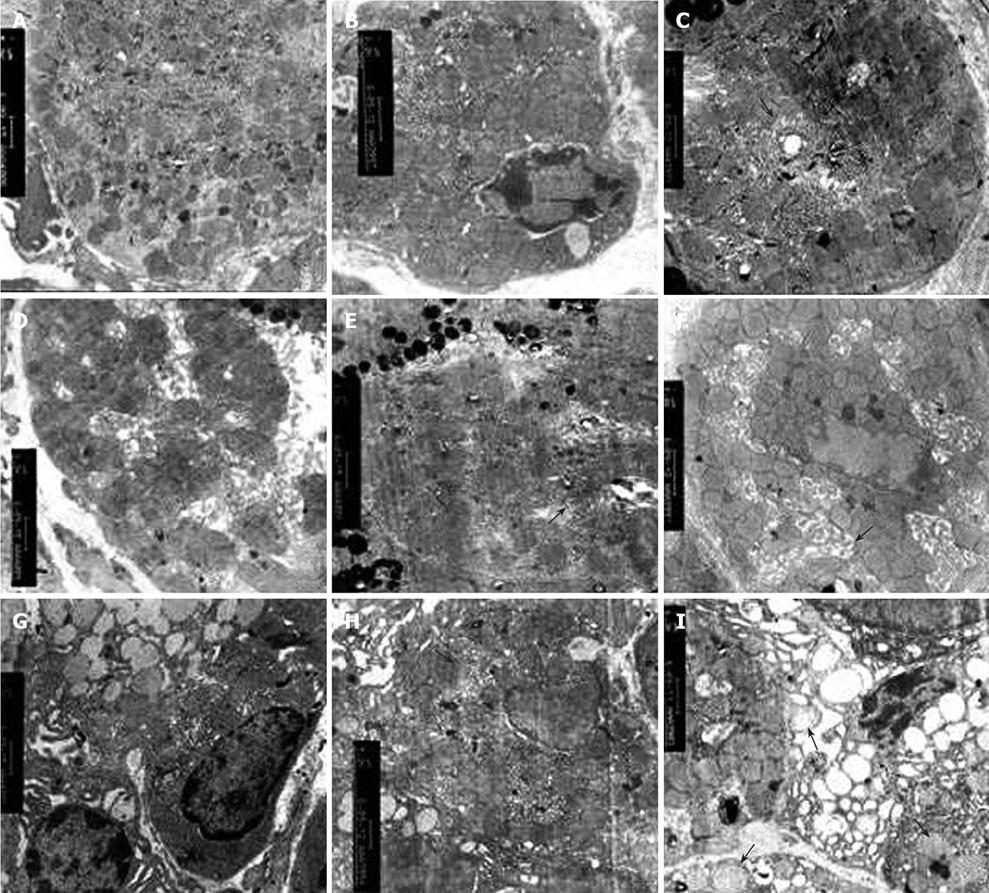
Figure 6 Changes in mitochondrial ultra-structure of rats with ethanol-induced chronic gastric mucosa injury 3 wk after administration of normal sodium (A), 25% (W/W) ethanol (B), and 45% (W/W) ethanol (C), respectively; 6 wk after administration of normal sodium (D), 25% (W/W) ethanol (E), and 45% (W/W) ethanol (F), respectively; 9 wk after administration normal sodium (G), 25% (W/W) ethanol (H), and 45% (W/W) ethanol (I), respectively.
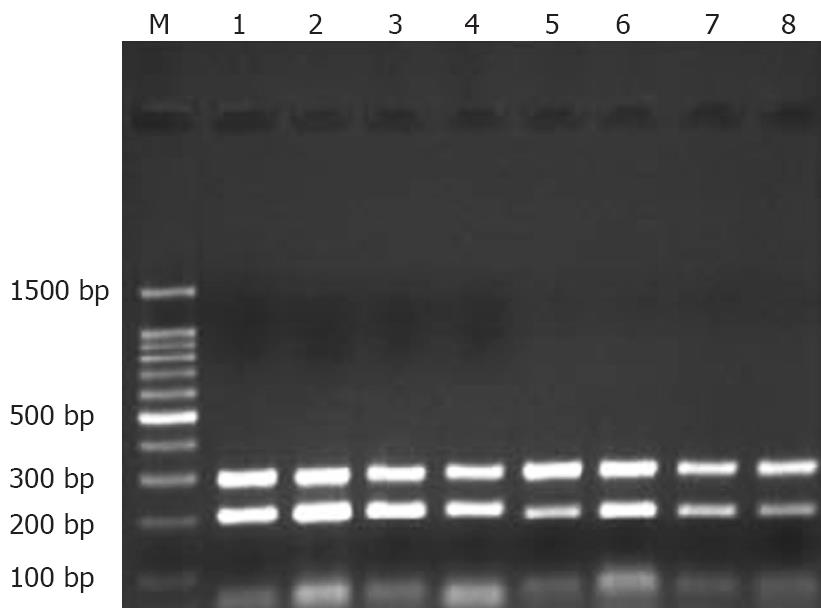
Figure 7 RT-PCR for expression of mtDNA ATPase subunits 6 and 8 mRNA in rates with ethanol-induced acute gastric mucosa injury.
M: 100 bp DNA ladder was a RT-PCR product of β-actin mRNA (upper row, 300 bp); lanes 1-4: RT-PCR products of mtDNA ATPase subunit 6 mRNA after treatment with normal sodium, 40% (W/W) ethanol, 70% (W/W) ethanol, and 100% (W/W) ethanol, respectively; lanes 5-8: RT-PCR products of mtDNA ATPase subunit 8 mRNA after treatment with normal sodium, 40% (W/W) ethanol, 70% (W/W) ethanol, and 100% (W/W) ethanol, respectively.
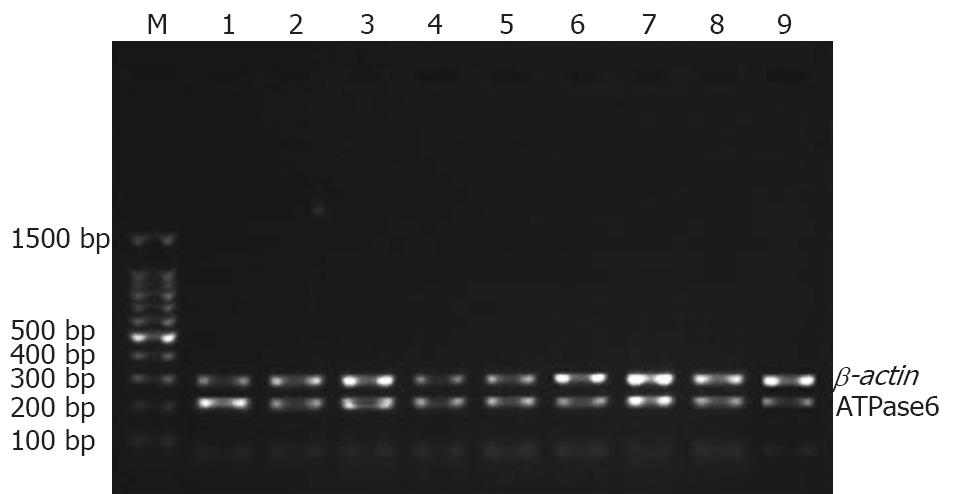
Figure 8 RT-PCR for expression of mtDNA ATPase subunit 6 mRNA in rats with ethanol-induced chronic gastric mucosa injury.
M: 100 bp DNA ladder of RT-PCR products of β-actin mRNA (upper row, 300 bp); lanes 1-9: RT-PCR products of mtDNA ATPase subunit 6 mRNA 3 wk after treatment with normal sodium, 25% (W/W) ethanol, and 45% (W/W) ethanol, respectively; 6 wk after treatment with normal sodium, 25% (W/W) ethanol, and 45% (W/W) ethanol, respectively; 9 wk after treatment with normal sodium, 25% (W/W) ethanol, and 45% (W/W) ethanol, respectively.
Figure 9 RT-PCR for expression of mtDNA ATPase subunit 8 mRNA in rats with ethanol-induced chronic gastric mucosa injury.
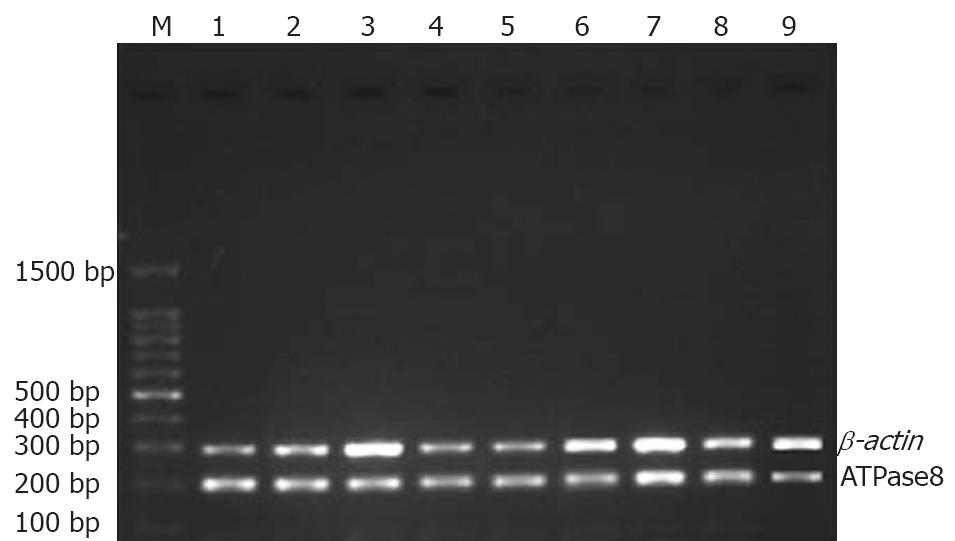
M: 100 bp DNA ladder of RT-PCR products of β-actin mRNA (upper row, 300 bp); lanes 1-9: RT-PCR products of mtDNA ATPase subunit 8 mRNA 3 wk after treatment with normal sodium, 25% (W/W) ethanol, and 45% (W/W) ethanol, respectively; 6 wk after treatment with normal sodium, 25% (W/W) ethanol, and 45% (W/W) ethanol, respectively; 9 wk after treatment with normal sodium, 25% (W/W) ethanol, and 45% (W/W) ethanol, respectively.
- Citation: Pan JS, He SZ, Xu HZ, Zhan XJ, Yang XN, Xiao HM, Shi HX, Ren JL. Oxidative stress disturbs energy metabolism of mitochondria in ethanol-induced gastric mucosa injury. World J Gastroenterol 2008; 14(38): 5857-5867
- URL: https://www.wjgnet.com/1007-9327/full/v14/i38/5857.htm
- DOI: https://dx.doi.org/10.3748/wjg.14.5857


