Copyright
©2008 The WJG Press and Baishideng.
World J Gastroenterol. Oct 7, 2008; 14(37): 5712-5716
Published online Oct 7, 2008. doi: 10.3748/wjg.14.5712
Published online Oct 7, 2008. doi: 10.3748/wjg.14.5712
Figure 1 Intercellular spaces between the most superficially located squamous epithelial cells were graded from 1 to 3.
Grade 1 (A) represents close and tight attachment. Grade 2 (B) represents loose attachment in some areas, with widened intercellular spaces (arrows). Grade 3 (C) represents further loosening of intercellular adhesion (× 2000).
Figure 2 The cellular surface structure of the uppermost epithelial cells was graded from 1 to 3.
Grade 1 (A) represented regularly shaped multiple folds. Grade 3 (C) represented an absence of such regularly shaped folds. A cellular surface intermediate between grades 1 and 3 was classified as grade 2 (B).
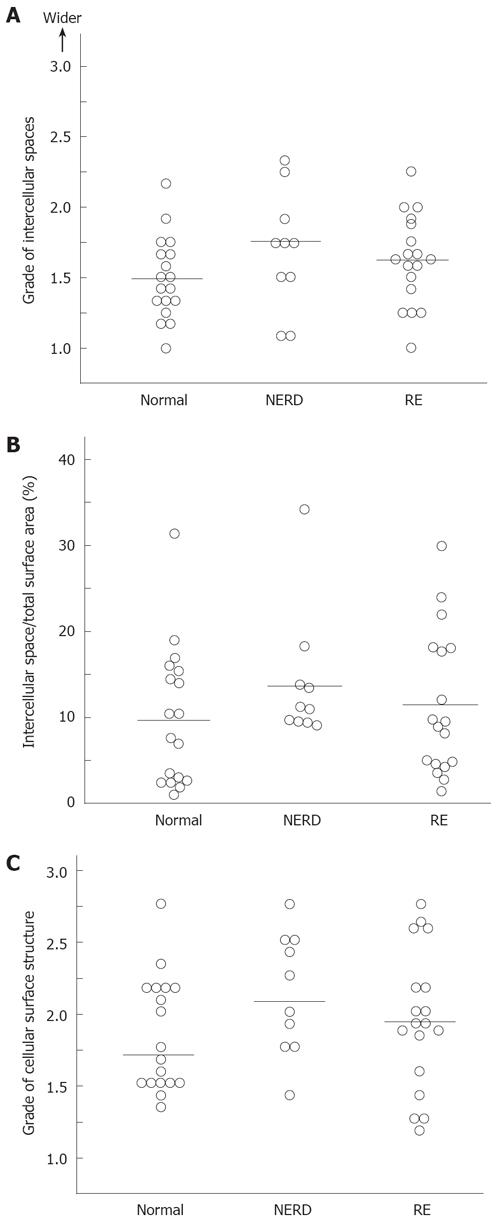
Figure 3 A: The intercellular spaces between the most superficially located squamous epithelial cells are shown.
Each dot represents an individual case and horizontal lines show the median values. There was no statistically significant difference among the groups; B: The intercellular spaces between the most superficially located squamous epithelial cells were quantified using the NIH Image program. The proportion of intercellular space relative to total superficial area was determined in individuals with NERD and RE, and in asymptomatic healthy individuals. Each dot represents an individual case. Horizontal lines show the median values. There was no statistically significant difference among the groups; C: The regularity of the luminal cellular surface structure of the squamous cells was compared between normal individuals and patients with RE or NERD. There was no difference in the cellular surface structure between normal individuals and patients with RE or NERD. Each dot represents an individual case and horizontal lines show the median values.
- Citation: Azumi T, Adachi K, Furuta K, Nakata S, Ohara S, Koshino K, Miki M, Morita T, Tanimura T, Ashizawa N, Kinoshita Y. Esophageal epithelial surface in patients with gastroesophageal reflux disease: An electron microscopic study. World J Gastroenterol 2008; 14(37): 5712-5716
- URL: https://www.wjgnet.com/1007-9327/full/v14/i37/5712.htm
- DOI: https://dx.doi.org/10.3748/wjg.14.5712


