Copyright
©2008 The WJG Press and Baishideng.
World J Gastroenterol. Oct 7, 2008; 14(37): 5707-5711
Published online Oct 7, 2008. doi: 10.3748/wjg.14.5707
Published online Oct 7, 2008. doi: 10.3748/wjg.14.5707
Figure 1 Measurement of ETT at different anatomical positions.
A: 90° (upright); B: 45° (fowler); C: 0° (supine). The positions of the magnetic sensors are presented (S1 = sensor one, and S2 = sensor 2).
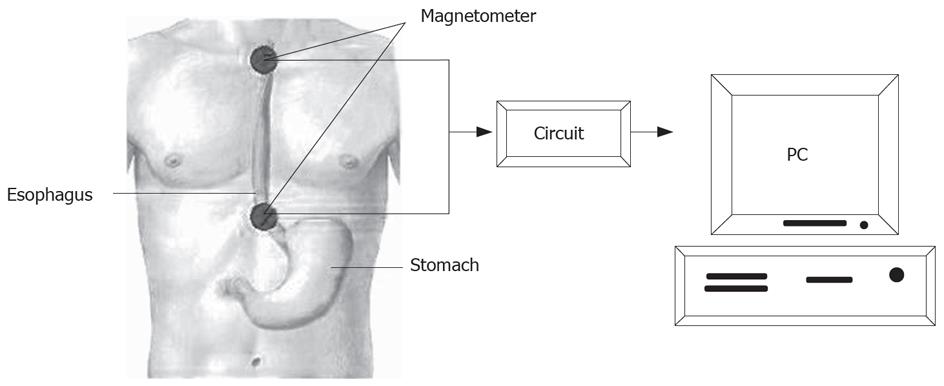
Figure 2 The schematic of the setup, anatomical location of the esophagus, and the circuits for data collection.
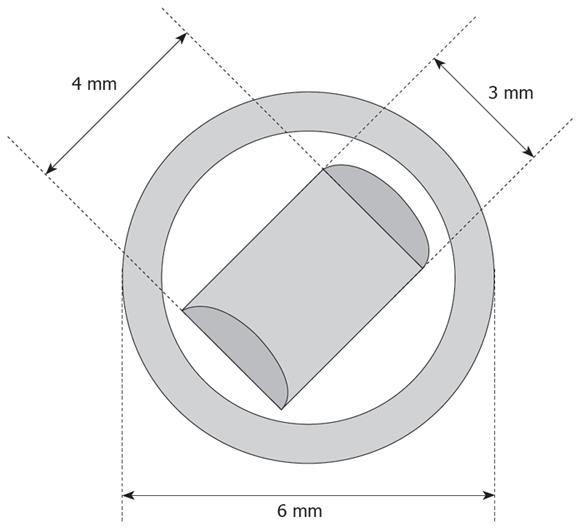
Figure 3 Cross-sectional profile of MM.
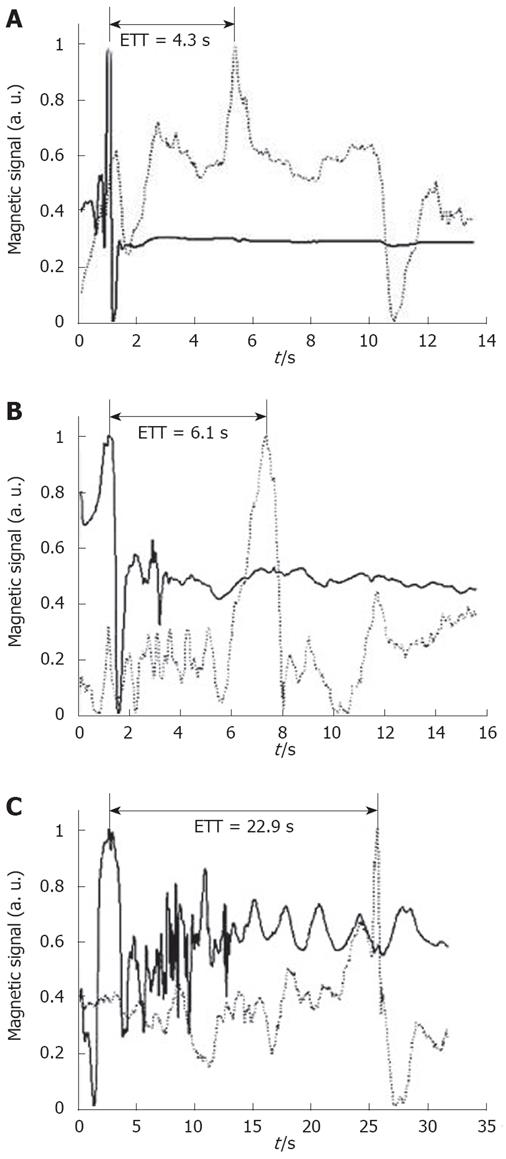
Figure 4 This series of graph showing the raw signal recorded from a single representative subject lying in the three angles of inclination: 90° (A), 45° (B) and 0° (C).
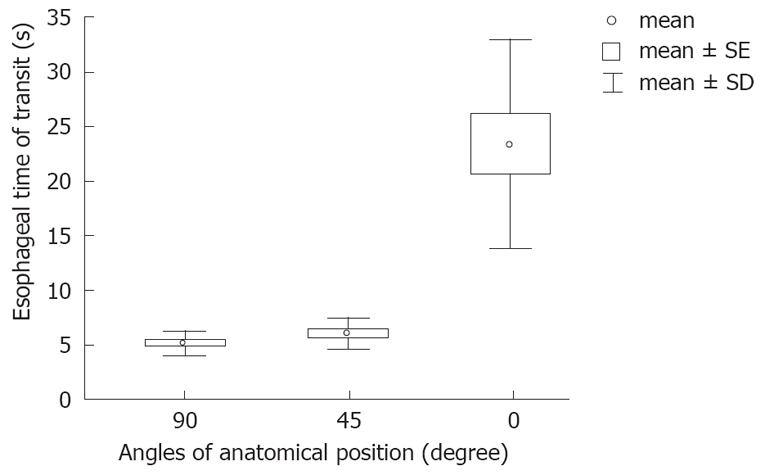
Figure 5 The results of one way ANOVA demonstrate statistically significant differences in the subjects’ ETT between the supine position (0°) and both the fowler (45°) and the upright (90°) positions.
- Citation: Cordova-Fraga T, Sosa M, Wiechers C, Roca-Chiapas JMDL, Moreles AM, Bernal-Alvarado J, Huerta-Franco R. Effects of anatomical position on esophageal transit time: A biomagnetic diagnostic technique. World J Gastroenterol 2008; 14(37): 5707-5711
- URL: https://www.wjgnet.com/1007-9327/full/v14/i37/5707.htm
- DOI: https://dx.doi.org/10.3748/wjg.14.5707


