Copyright
©2008 The WJG Press and Baishideng.
World J Gastroenterol. Sep 14, 2008; 14(34): 5311-5315
Published online Sep 14, 2008. doi: 10.3748/wjg.14.5311
Published online Sep 14, 2008. doi: 10.3748/wjg.14.5311
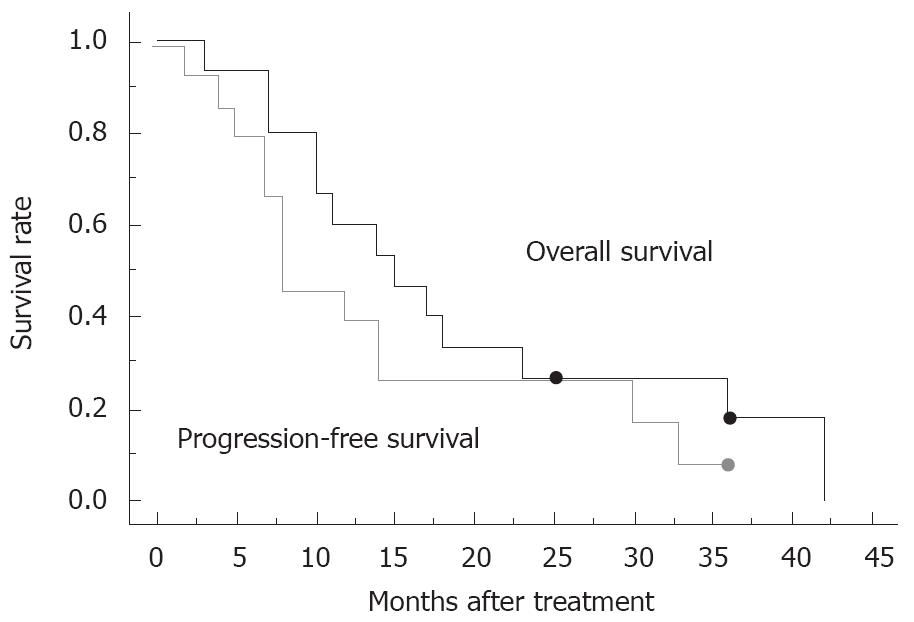
Figure 1 Overall survival curve and progression-free survival curve for 15 patients who received chemoradiotherapy under this study protocol.
Dot indicates censored cases.
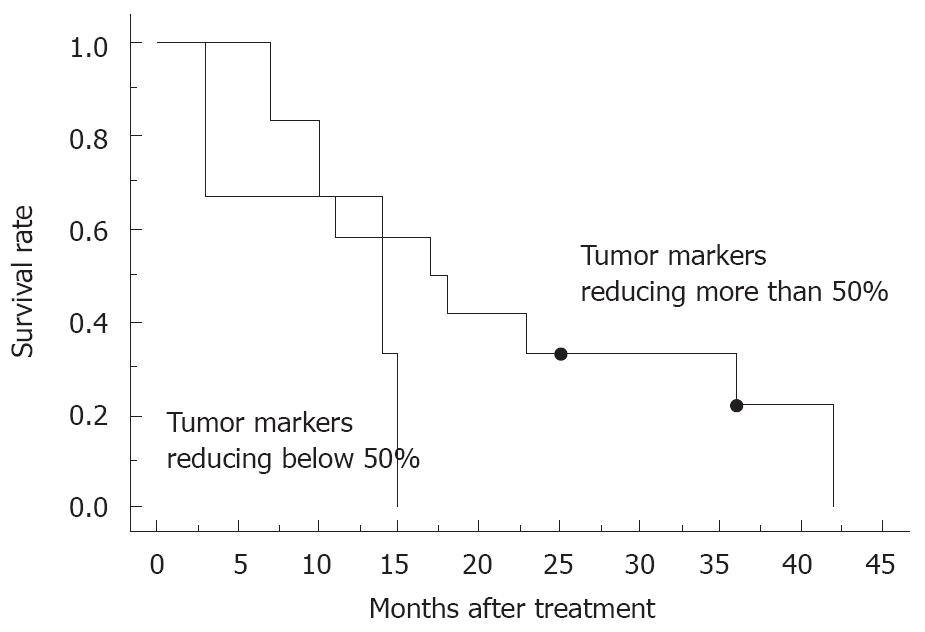
Figure 2 Overall survival curve for patients with tumor markers reducing more than 50% compared to that of pretreatment (n = 12) and those reducing below 50% (n = 3).
Dot indicates censored cases.
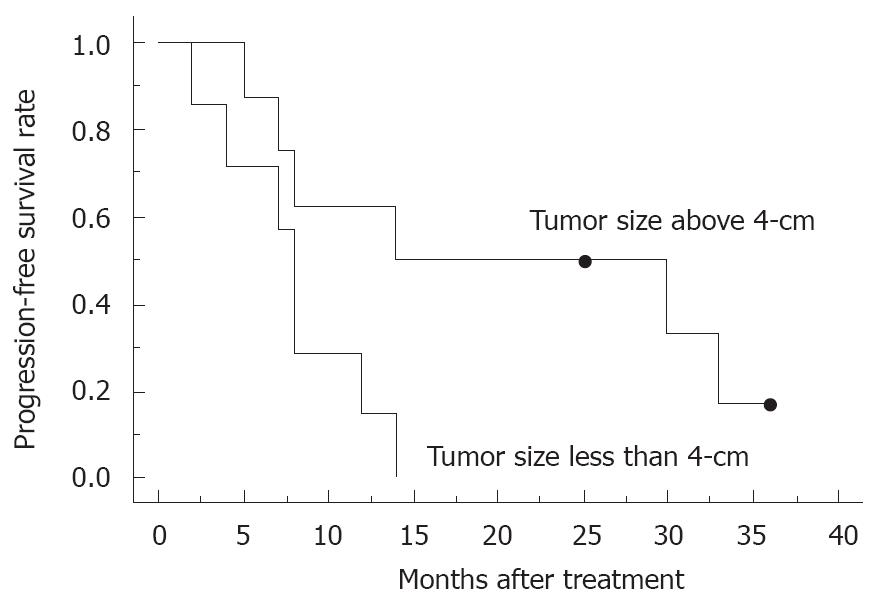
Figure 3 Progression free-survival curve for patients with tumor size less than 4-cm (n = 6) and those with a size above 4-cm (n = 9).
Dot indicates censored cases.
- Citation: Igarashi H, Ito T, Kawabe K, Hisano T, Arita Y, Kaku T, Takayanagi R. Chemoradiotherapy with twice-weekly administration of low-dose gemcitabine for locally advanced pancreatic cancer. World J Gastroenterol 2008; 14(34): 5311-5315
- URL: https://www.wjgnet.com/1007-9327/full/v14/i34/5311.htm
- DOI: https://dx.doi.org/10.3748/wjg.14.5311


