Copyright
©2008 The WJG Press and Baishideng.
World J Gastroenterol. Aug 21, 2008; 14(31): 4873-4879
Published online Aug 21, 2008. doi: 10.3748/wjg.14.4873
Published online Aug 21, 2008. doi: 10.3748/wjg.14.4873
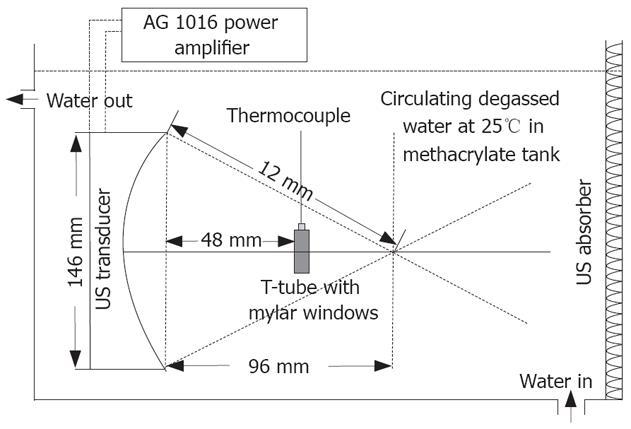
Figure 1 US irradiation system.
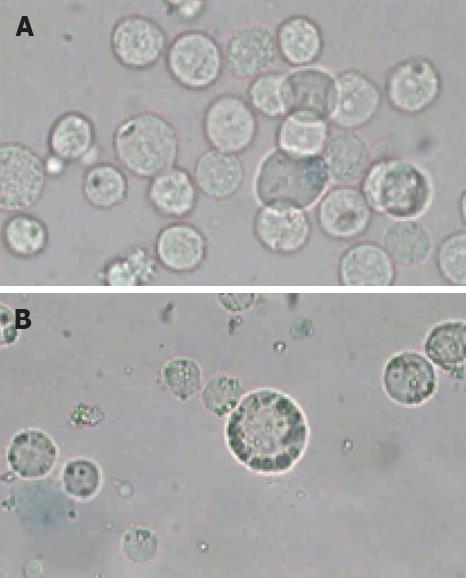
Figure 2 Morphologic characteristics of SGC-7901 cells before and after US irradiation.
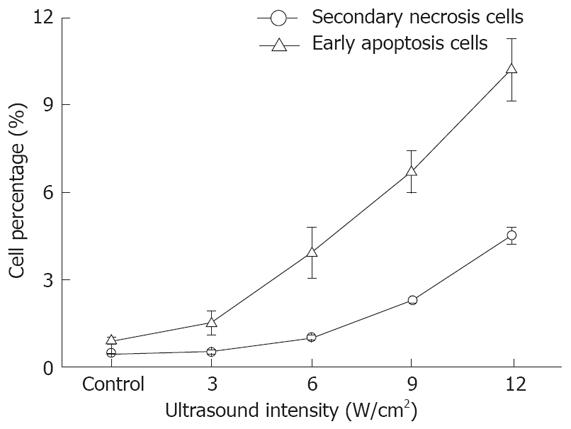
Figure 3 Percentage of early apoptotic cells and secondary necrosis cells in control and US-irradiated SGC-7901 cells at different US intensities.
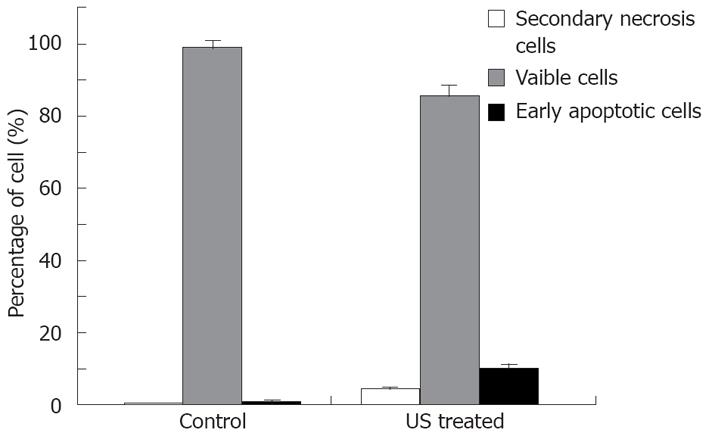
Figure 4 Percentage of viable cells, early apoptotic cells and secondary necrosis cells in the control and US-irradiated SGC-7901 cells.
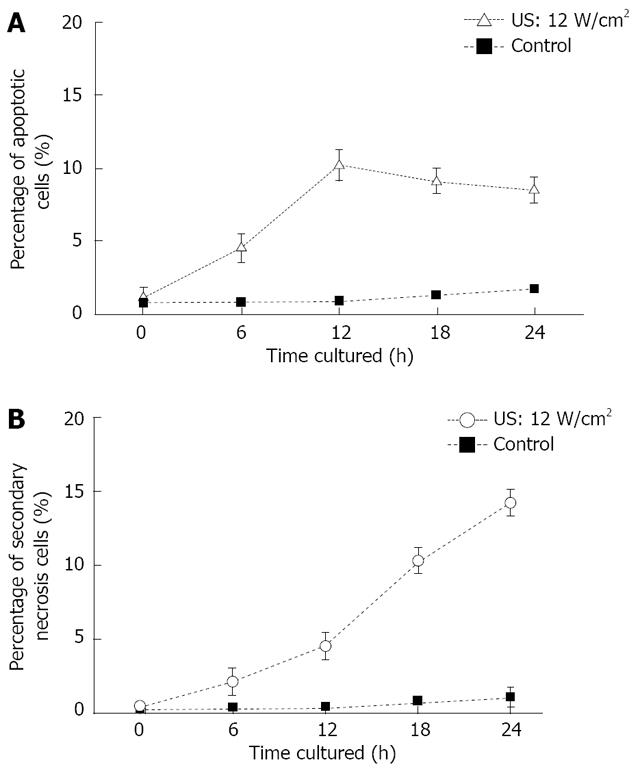
Figure 5 US-induced early apoptosis (A) and secondary necrosis (B) as a function of culture time after US irradiation, determined by FCM.
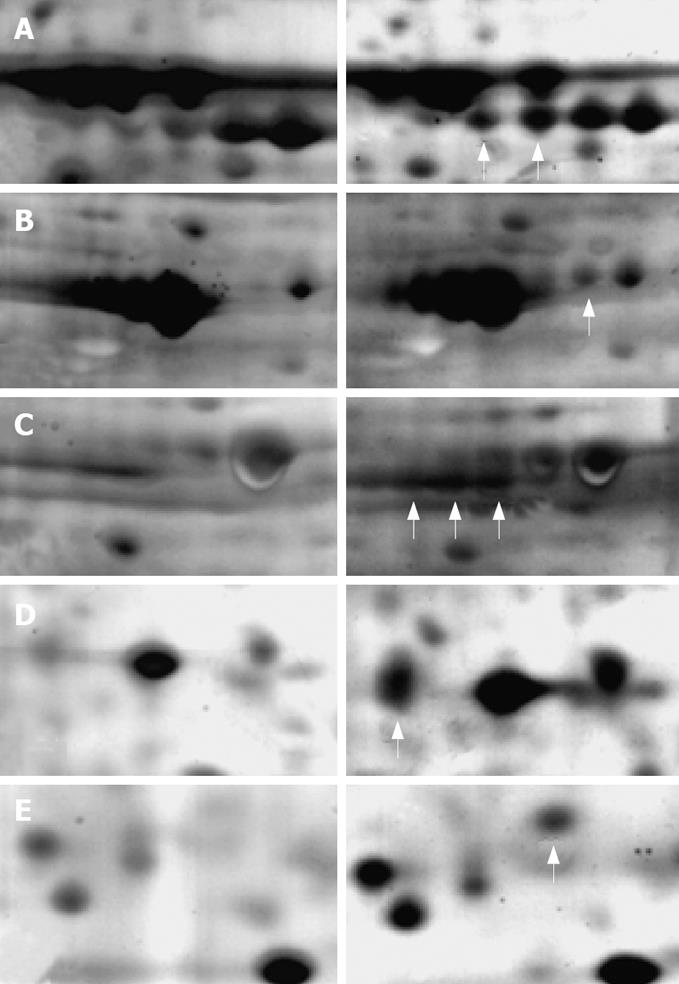
Figure 6 Magnified features of protein spots with different expressing characteristics after US irradiation.
Arrow points to the differently expressed protein spots. A: Bip; B: HSP70; C: CH60; D: Calreticulin; E: Prohibitin.
- Citation: Feng Y, Tian ZM, Wan MX, Zheng ZB. Low intensity ultrasound-induced apoptosis in human gastric carcinoma cells. World J Gastroenterol 2008; 14(31): 4873-4879
- URL: https://www.wjgnet.com/1007-9327/full/v14/i31/4873.htm
- DOI: https://dx.doi.org/10.3748/wjg.14.4873


