Copyright
©2008 The WJG Press and Baishideng Publishing.
World J Gastroenterol. Aug 14, 2008; 14(30): 4745-4752
Published online Aug 14, 2008. doi: 10.3748/wjg.14.4745
Published online Aug 14, 2008. doi: 10.3748/wjg.14.4745
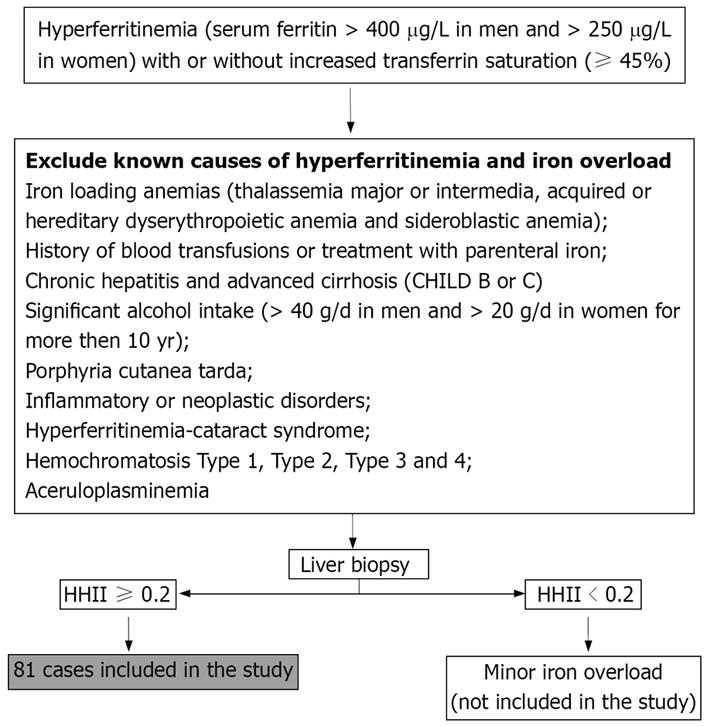
Figure 1 Selection criteria of the 81 patients included in the study.
HHII: Histological Hepatic Iron Index [Total iron score/ Age (years)].
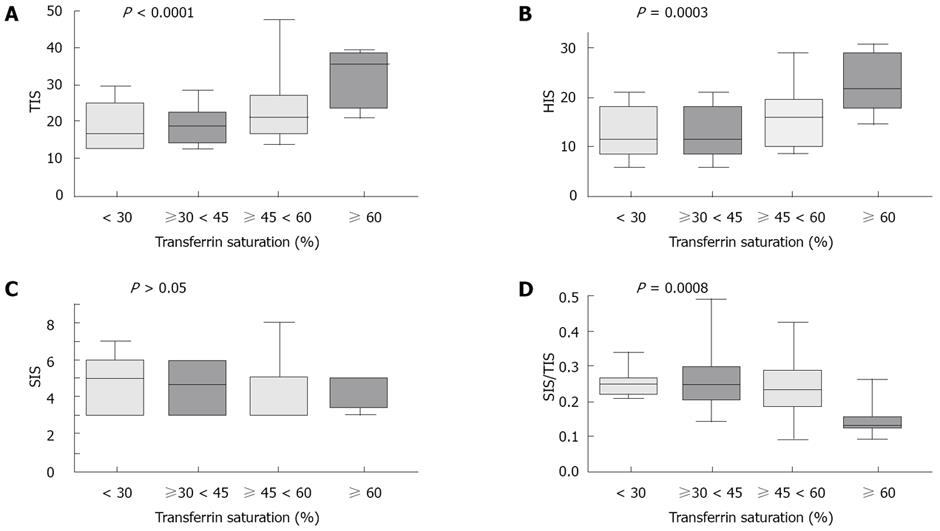
Figure 2 Total iron score (TIS, P < 0.
0001), hepatocytic iron score (HIS, P = 0.0003), sinusoidal iron score (SIS, P > 0.05) and sinusoidal to total iron score ratio (SIS/TIS, P = 0.0008) according to transferrin saturation. The box includes all the observations between the first and the third quartile, the horizontal bar represents the median. Whiskers extend from the edges of the box to the extreme values.
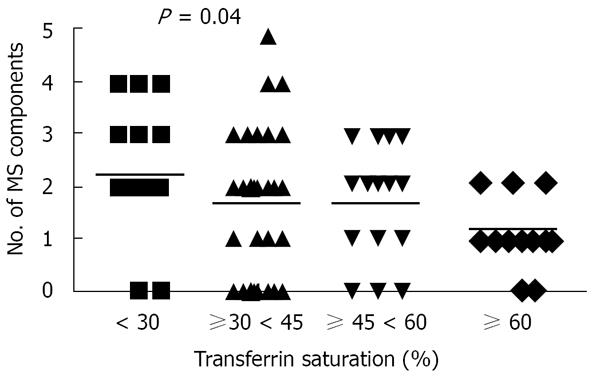
Figure 3 Number of MS components by transferrin saturation (P = 0.
04).
Figure 4 Receiving operating curve relative to 1, 2, 3, 4 and 5 components of the MS.
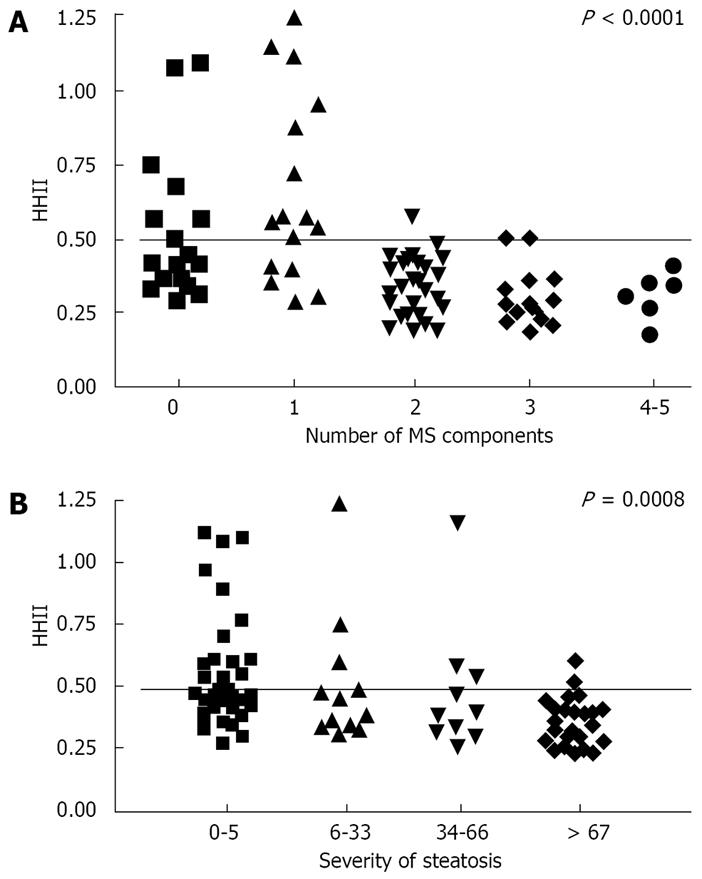
Figure 5 Distribution of HHII (histological hepatic iron index) according to number of MS components (A) and the degree of hepatic steatosis (B).
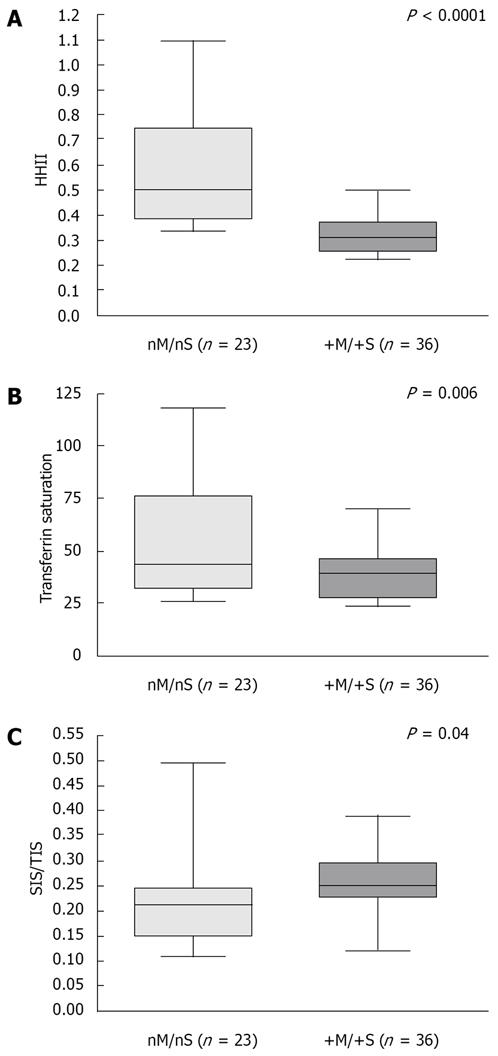
Figure 6 Distribution of HHII (histological hepatic iron index), transferrin saturation and Sinusoidal/Total Iron Score (SIS/TIS) in patients with 0-1 MS components and absence of steatosis (nM/nS) and patients with 2 MS alterations and steatosis (+M/+S).
- Citation: Riva A, Trombini P, Mariani R, Salvioni A, Coletti S, Bonfadini S, Paolini V, Pozzi M, Facchetti R, Bovo G, Piperno A. Revaluation of clinical and histological criteria for diagnosis of dysmetabolic iron overload syndrome. World J Gastroenterol 2008; 14(30): 4745-4752
- URL: https://www.wjgnet.com/1007-9327/full/v14/i30/4745.htm
- DOI: https://dx.doi.org/10.3748/wjg.14.4745


