Copyright
©2008 The WJG Press and Baishideng.
World J Gastroenterol. Jul 28, 2008; 14(28): 4551-4557
Published online Jul 28, 2008. doi: 10.3748/wjg.14.4551
Published online Jul 28, 2008. doi: 10.3748/wjg.14.4551
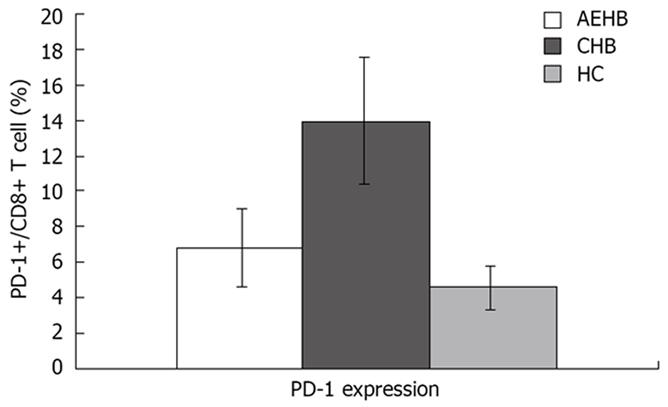
Figure 1 PD-1 expression on CD8+ T cells in patients with acute exacerbation of hepatitis B (AEHB), chronic hepatitis B (CHB) and healthy controls (HC).
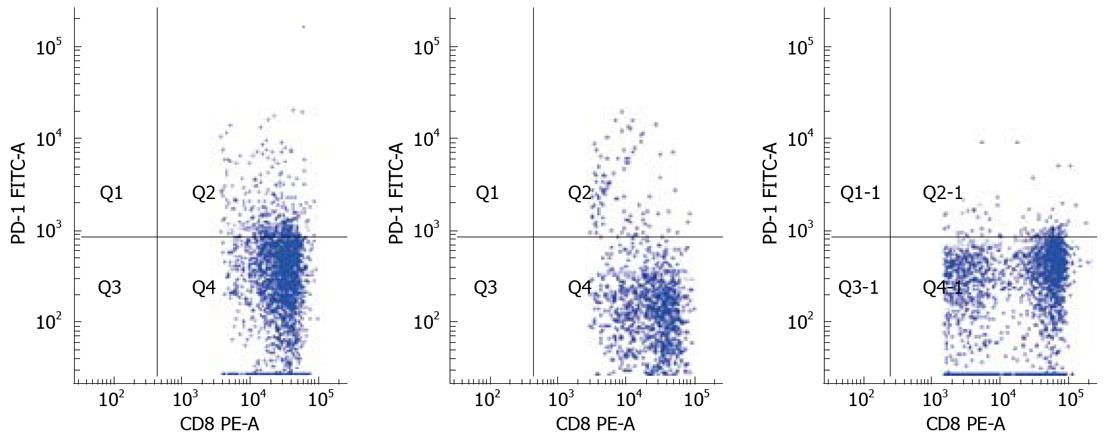
Figure 2 Comparison of PD-1 expression on CD8+ T cells in healthy controls (HC; 5.
8%), chronic hepatitis B (CHB; 12.7%), and acute exacerbation of hepatitis B (AEHB; 7.1%).
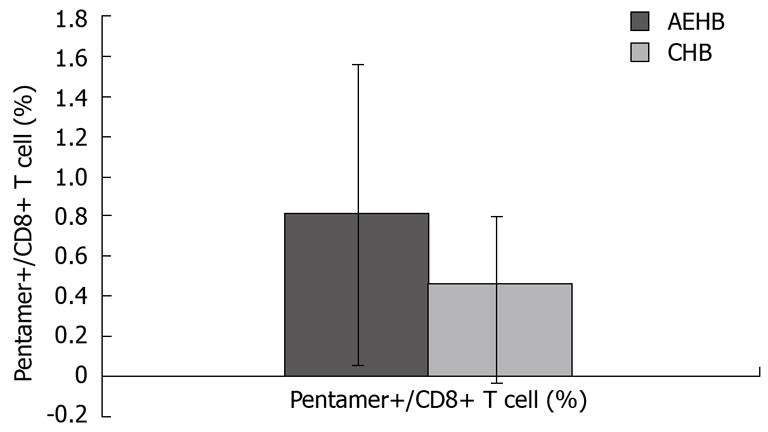
Figure 3 The number of HBV-specific CD8 T cells in CHB and AEHB patients.
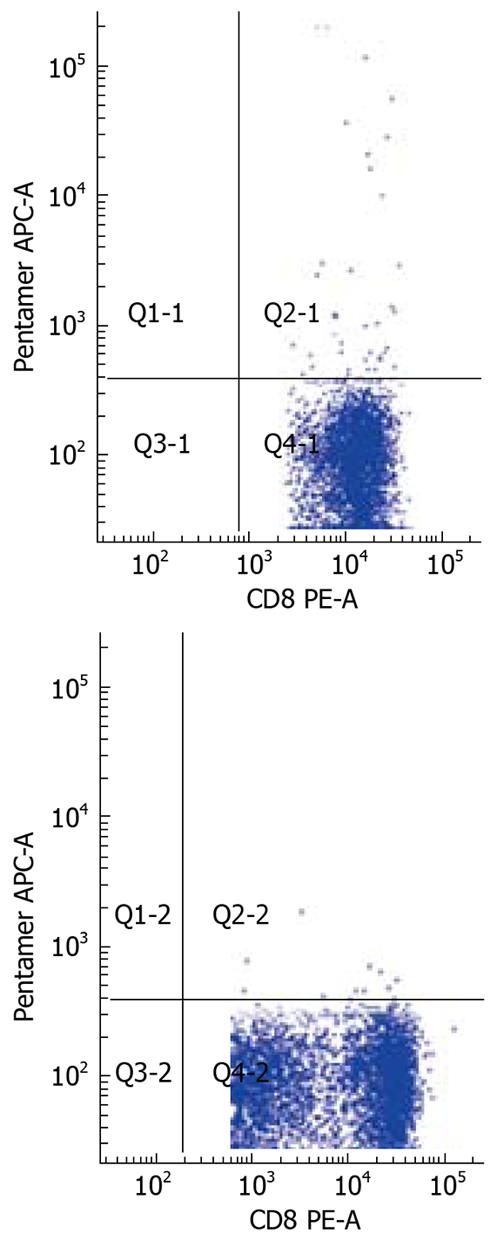
Figure 4 The number of HBV-specific CD8 T cells in two patients with CHB (0.
07%) and AEHB (0.31%) respectively.
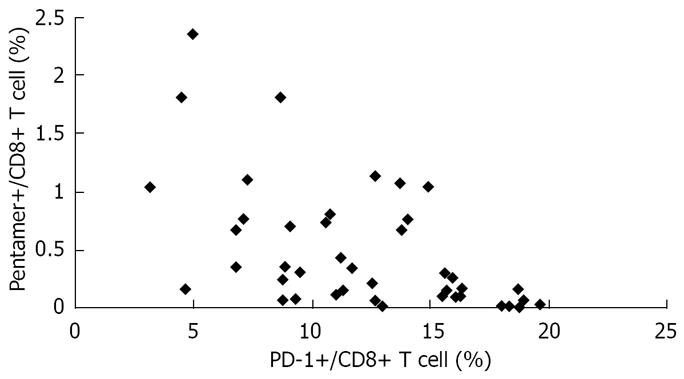
Figure 5 Significant inverse correlation between the number of HBV-specific CD8 T-cells and the level of PD-1 expression in patients with AEHB and CHB (R = 0.
541, P < 0.01).
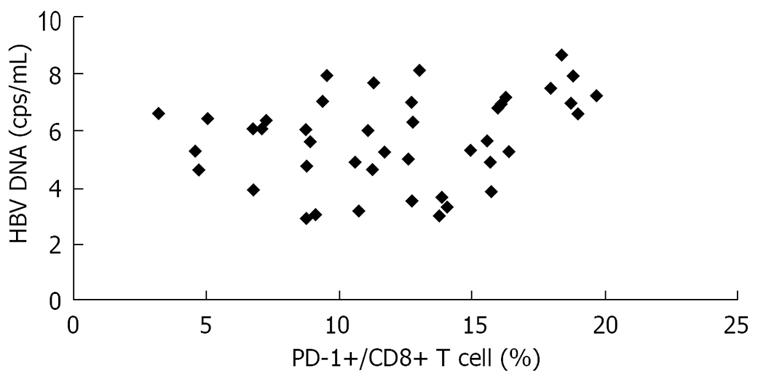
Figure 6 Positive correlation between serum viral load and level of PD-1 expression on CD8+ T cells in patients with CHB and AEHB (R = 0.
272, P < 0.05).
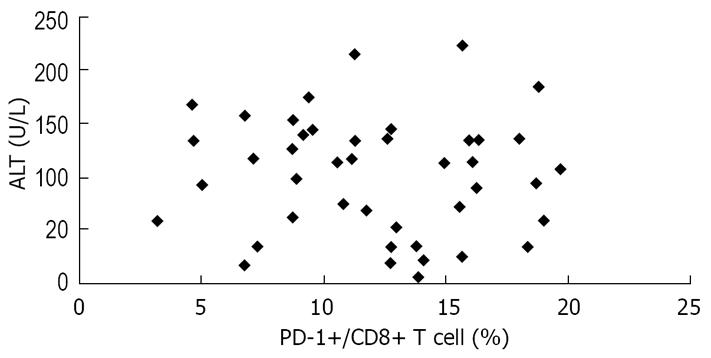
Figure 7 Lack of significant correlation between PD-1 expression and serum ALT levels in the study patients (R = 0.
066, P > 0.05).
- Citation: Ye P, Weng ZH, Zhang SL, Zhang JA, Zhao L, Dong JH, Jie SH, Pang R, Wei RH. Programmed death-1 expression is associated with the disease status in hepatitis B virus infection. World J Gastroenterol 2008; 14(28): 4551-4557
- URL: https://www.wjgnet.com/1007-9327/full/v14/i28/4551.htm
- DOI: https://dx.doi.org/10.3748/wjg.14.4551


