Copyright
©2008 The WJG Press and Baishideng.
World J Gastroenterol. Jul 28, 2008; 14(28): 4462-4472
Published online Jul 28, 2008. doi: 10.3748/wjg.14.4462
Published online Jul 28, 2008. doi: 10.3748/wjg.14.4462
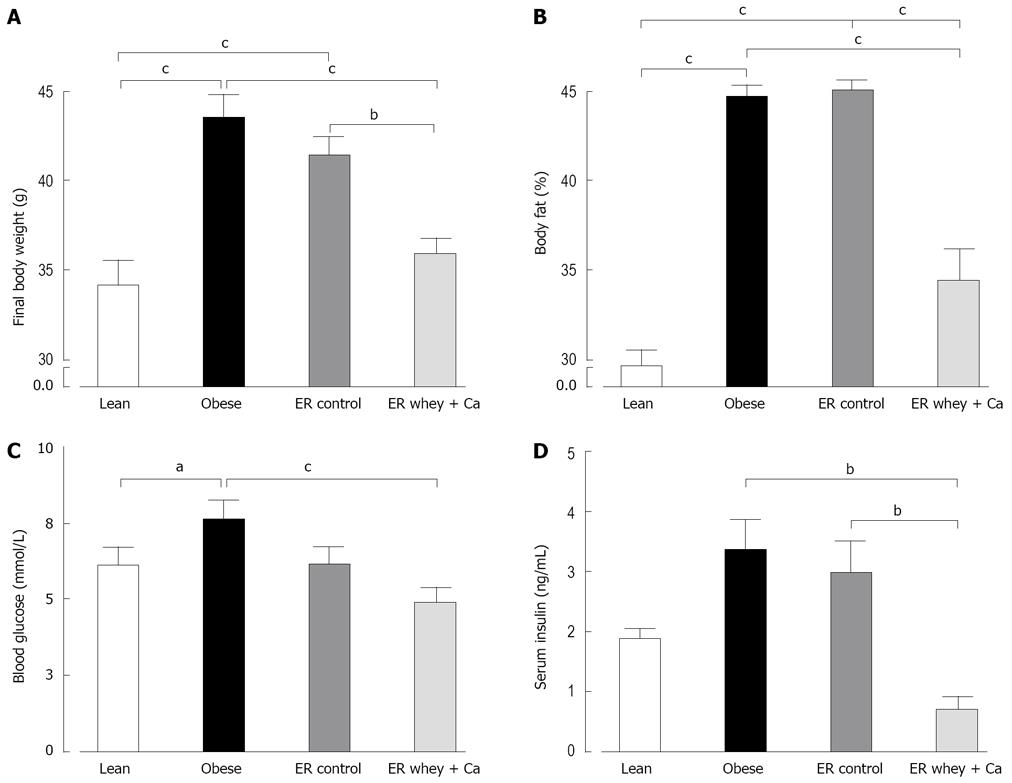
Figure 1 A: The body weight of C57Bl/6J mice at the end of the study; B: The body fat content of C57Bl/6J mice measured by DEXA at the end of the study; C: The blood glucose of C57Bl/6J mice at the end of the study; D: The serum insulin of C57Bl/6J mice at the end of the study.
Data is presented as mean ± SE. The letters denote a significant difference between the groups (aP < 0.05; bP < 0.01, cP < 0.001; n = 10/group).
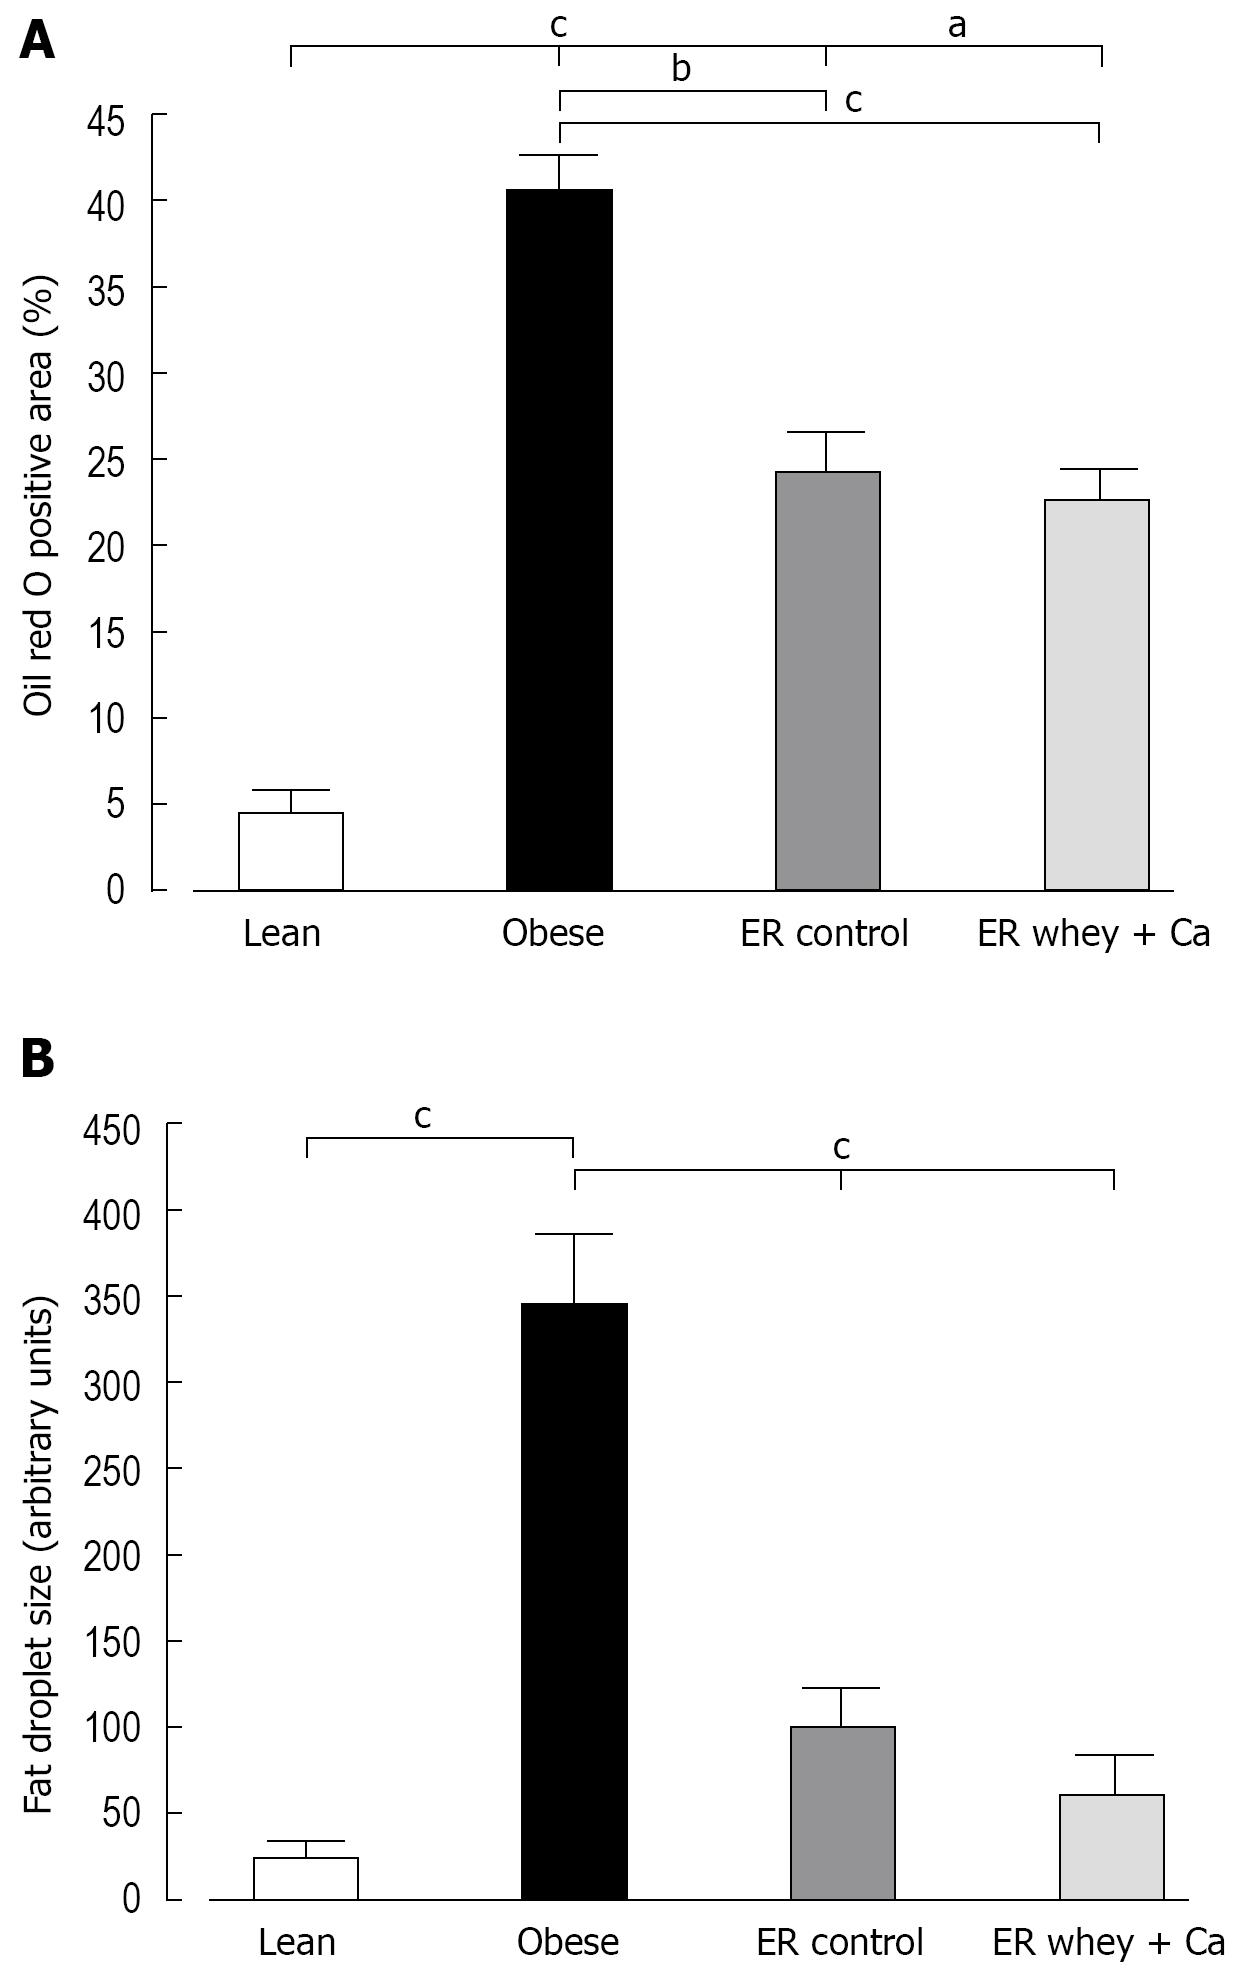
Figure 2 A: The Oil Red O positive area of paraffin embedded liver samples of C57Bl/6J mice at the end of the study; B: The mean fat droplet area (arbitrary units) of paraffin embedded liver samples of C57Bl/6J mice at the end of the study.
Data is presented as mean ± SE. The letters denote the significant difference between the groups (aP < 0.05; bP < 0.01, cP < 0.001; n = 10/group).
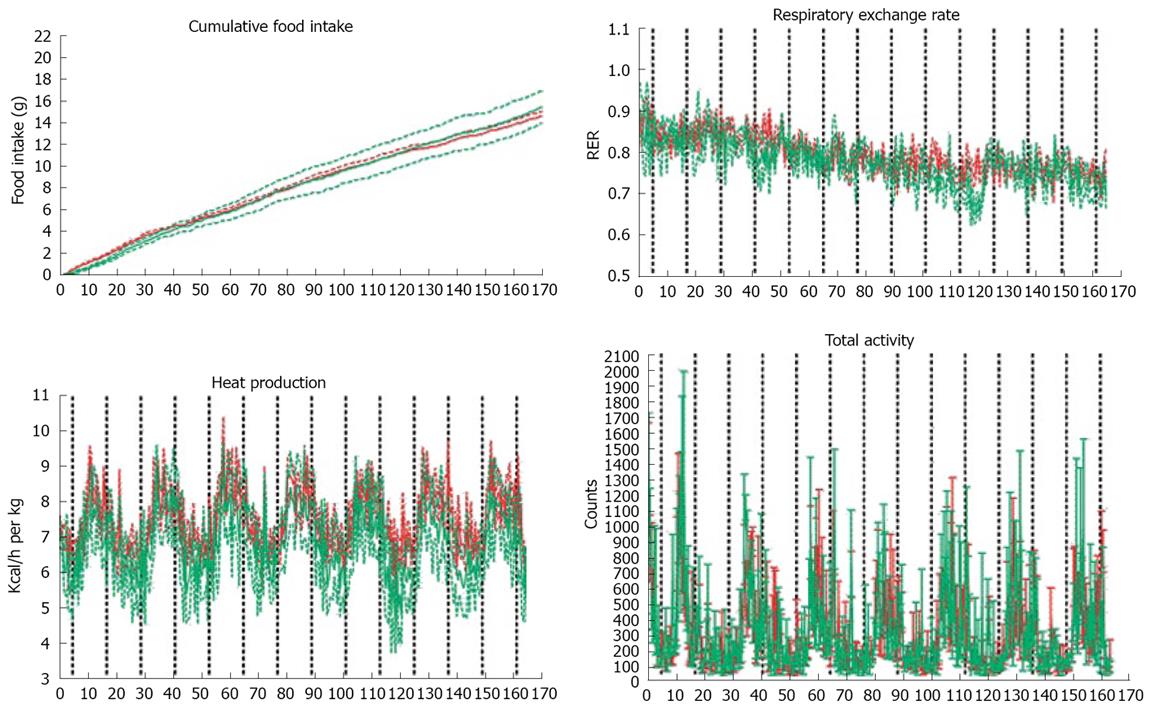
Figure 3 A: Cumulative food intake over 7 d analyzed by LabMaster system.
The cumulative total food intake was similar between the groups; B: LabMaster analysis of respiratory exchange rate (RER); C: Heat production measured by LabMaster; D: Total ambulatory movement did not differ between the groups. In all figures data is presented as mean ± SE, n = 4 in casein group (red) and n = 3 in whey group (green).
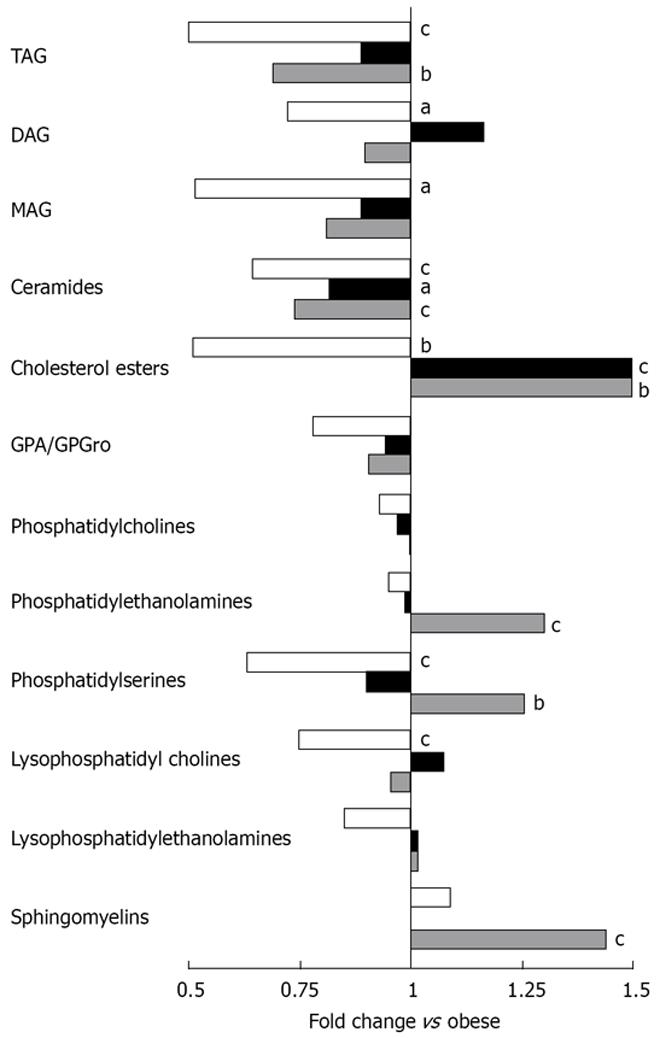
Figure 4 Mean fold changes in lipid classes in lean (white), ER control (black) and ER whey + Ca (grey) groups in relation to the obese group (n = 10/group).
The letters denote a significant difference in comparison with the obese group (aP < 0.05, bP < 0.01, cP < 0.001).
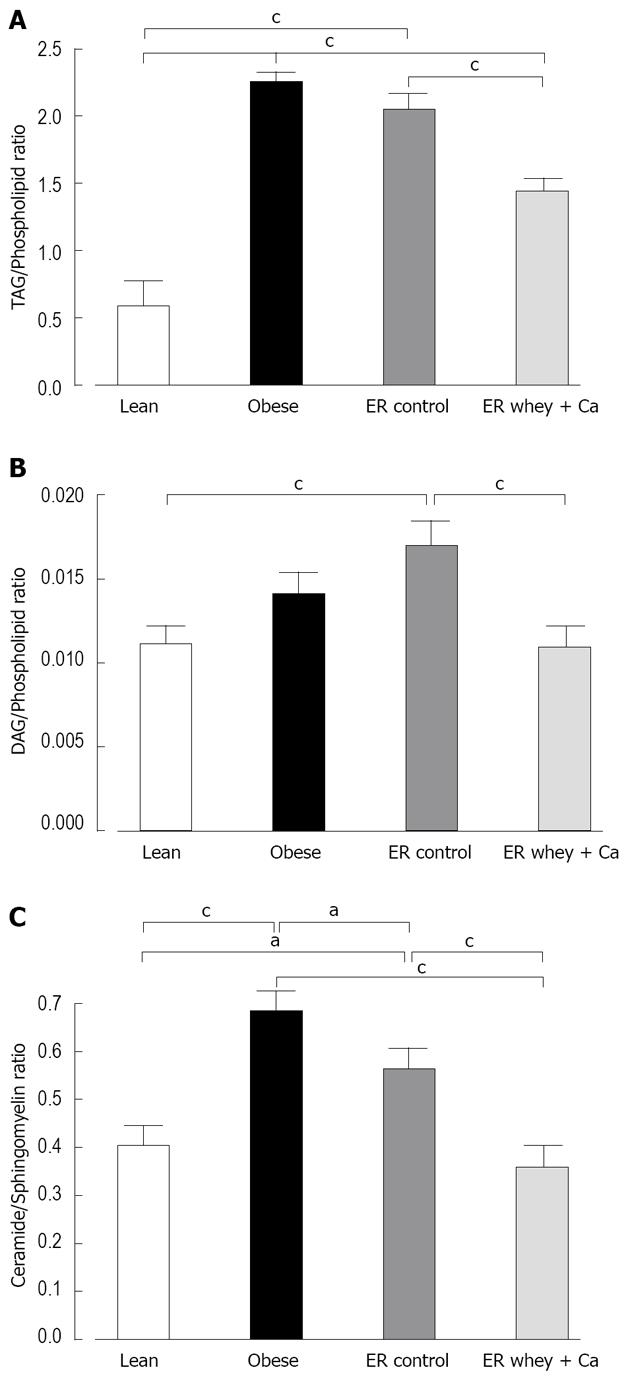
Figure 5 A: The liver TAG/Phospholipid ratio; B: The liver DAG/Phospholipid ratio; C: The liver Ceramide/Sphingomyelin ratio.
Lipids measured by UPLC/MS. Data is presented as mean ± SE. The letters denote a significant difference between the groups (aP < 0.05; bP < 0.01, cP < 0.001; n = 10/group).
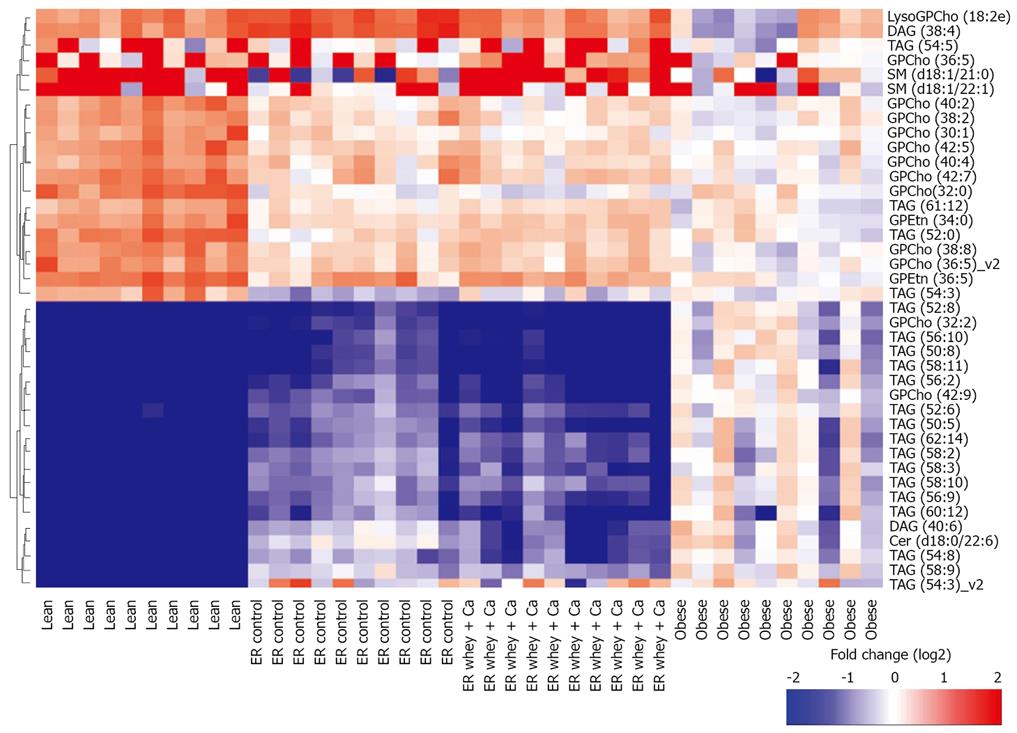
Figure 6 Twenty most significantly up- and down-regulated lipids between obese and lean group.
Fold change for each individual mouse within each group as a log2 ratio between the lipid concentration in individual sample and the median lipid concentration in the obese group. Hierarchical clustering using Ward linkage was applied.
Figure 7 Primary metabolite profiles for each individual mouse as a log2 ratio between the metabolite concentration in individual samples and the median metabolite concentration in the obese group.
Hierarchical clustering using Ward linkage was applied.
- Citation: Pilvi TK, Seppänen-Laakso T, Simolin H, Finckenberg P, Huotari A, Herzig KH, Korpela R, Orešič M, Mervaala EM. Metabolomic changes in fatty liver can be modified by dietary protein and calcium during energy restriction. World J Gastroenterol 2008; 14(28): 4462-4472
- URL: https://www.wjgnet.com/1007-9327/full/v14/i28/4462.htm
- DOI: https://dx.doi.org/10.3748/wjg.14.4462


