Copyright
©2008 The WJG Press and Baishideng.
World J Gastroenterol. Jul 21, 2008; 14(27): 4370-4376
Published online Jul 21, 2008. doi: 10.3748/wjg.14.4370
Published online Jul 21, 2008. doi: 10.3748/wjg.14.4370
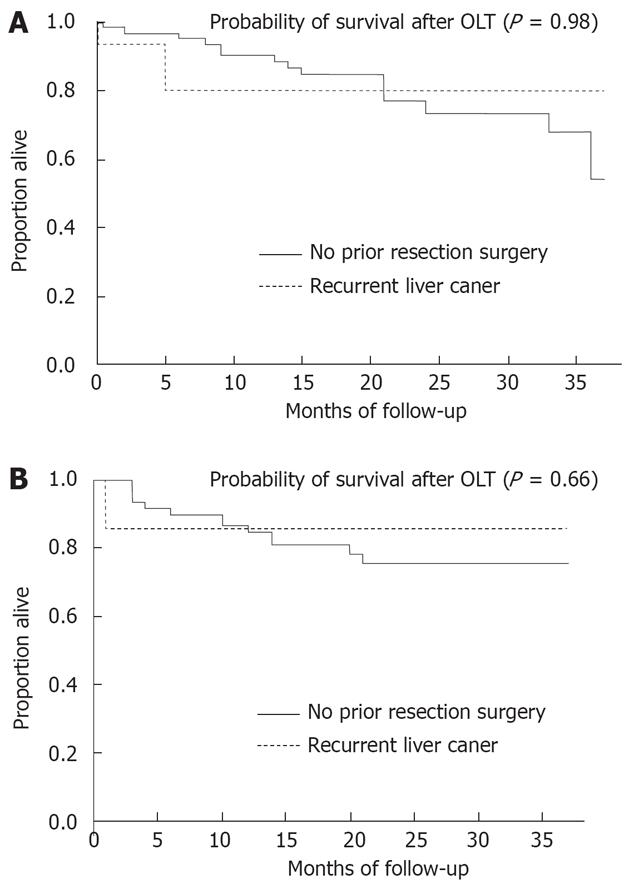
Figure 1 Probability of overall survival and tumor-free survival after ortotopic liver transplantation- Kaplan-Meier curves.
A: Interaction between time and groups was verified as the two curves cross each other suggest non-proportionality of the hazards but this is not found statistically significant (P = 0.98); B: Interaction between time and groups was verified as the two curves cross each other suggest non-proportionality of the hazards, but not statistically significant (P = 0.66).
- Citation: Shao Z, Lopez R, Shen B, Yang GS. Orthotopic liver transplantation as a rescue operation for recurrent hepatocellular carcinoma after partial hepatectomy. World J Gastroenterol 2008; 14(27): 4370-4376
- URL: https://www.wjgnet.com/1007-9327/full/v14/i27/4370.htm
- DOI: https://dx.doi.org/10.3748/wjg.14.4370


