Copyright
©2008 The WJG Press and Baishideng.
World J Gastroenterol. Jul 21, 2008; 14(27): 4324-4331
Published online Jul 21, 2008. doi: 10.3748/wjg.14.4324
Published online Jul 21, 2008. doi: 10.3748/wjg.14.4324
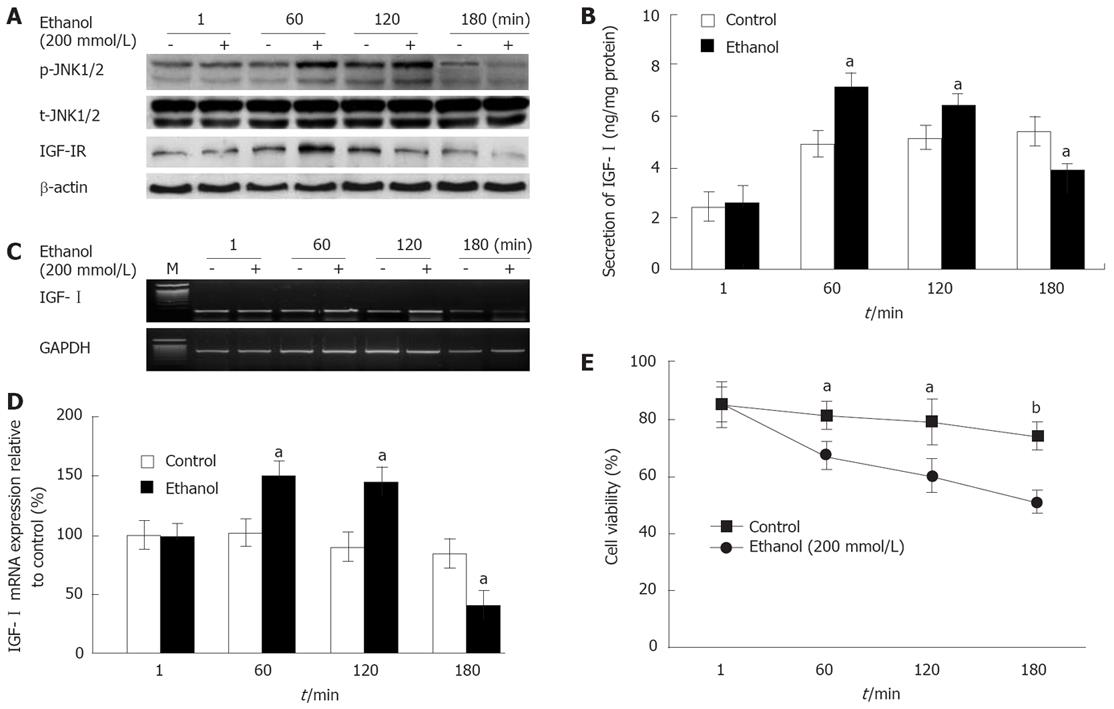
Figure 1 Time course of effects on the IGF-I system, JNK1/2 activity, and cell viability induced by ethanol in primary cultured rat hepatocytes (mean ± SD).
The cells were exposed to 200 mmol/L ethanol for 0, 60, 120 and 180 min. A: P-JNK1/2, t-JNK1/2, and IGF-IR activities; B: IGF-I concentration; C and D: IGF-I mRNA expression; E: Cell viability. β-actin (A) and GAPDH (C) were used as loading controls. The mRNA expression (as indicated by a band at 180 bp, C) was determined by densitometric analysis (D) of the amplification products. Data represent percentages relative to control. The cell viability (D) was determined by the MTT assay. aP < 0.05, bP < 0.01 vs control (n = 6).
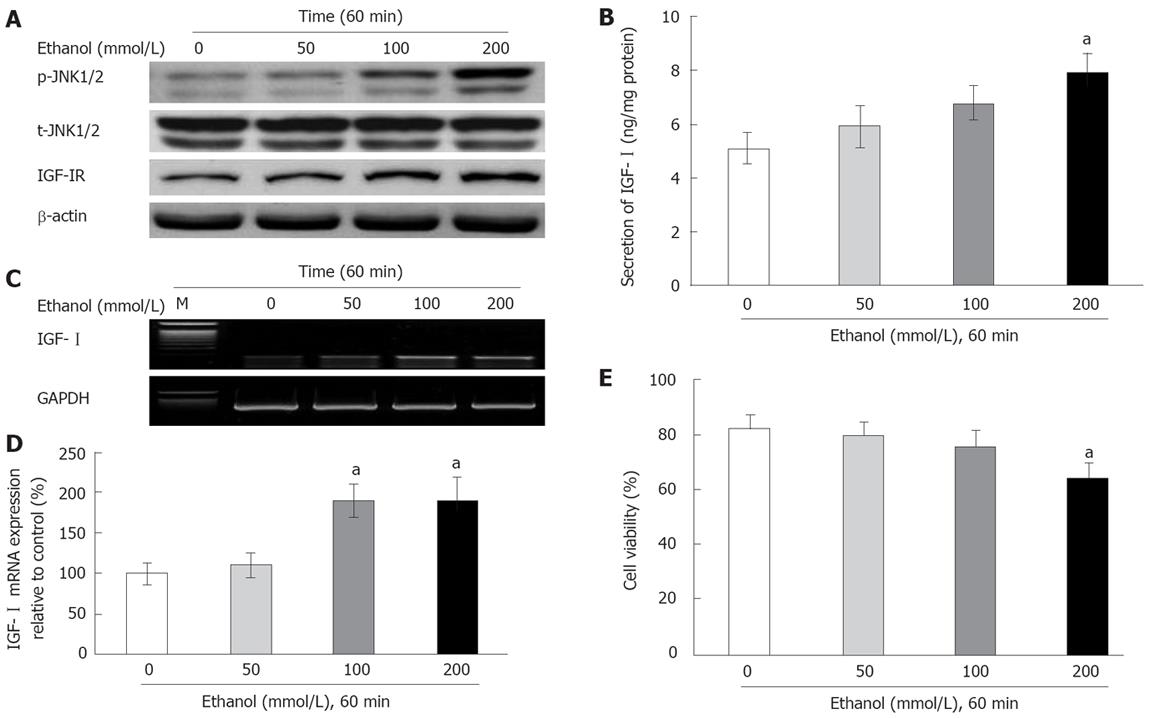
Figure 2 Effects of ethanol on the IGF-I system, JNK1/2 activity, and cell viability at different concentrations (0, 50, 100 and 200 mmol/L) in primary cultured hepatocytes (mean ± SD).
The cells were exposed to ethanol at different concentrations for 60 min. A: P-JNK1/2, t-JNK1/2, and IGF-IR activities; B: IGF-I concentration; C and D: IGF-I mRNA expression; E: Cell viability. β-actin (A) and GAPDH (C) were used as loading controls. The mRNA expression (as indicated by a band at 180 bp, C) was determined by densitometric analysis (D) of the amplification products. Data represent percentages relative to control. The cell viability (D) was determined by the MTT assay. aP < 0.05, vs control (n = 6).
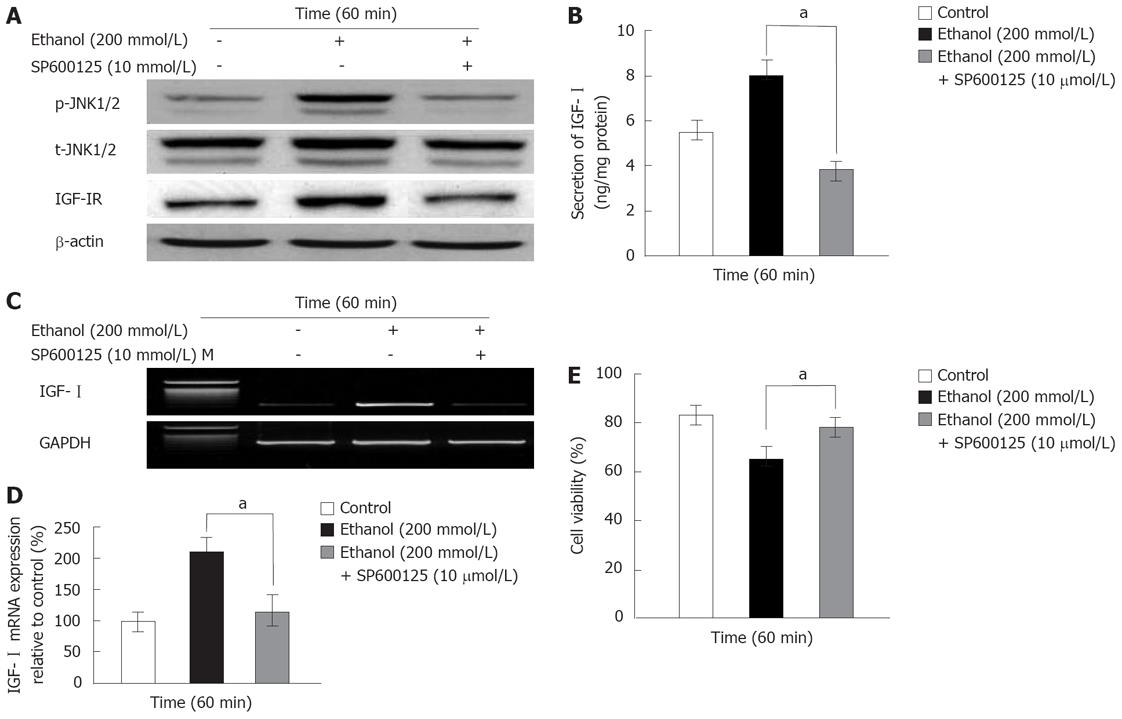
Figure 3 Effects of JNK1/2 inhibitor on the IGF-I system, cell viability, and activity of JNK1/2 induced by ethanol at 60 min in primary cultured rat hepatocytes (mean ± SD).
The cells were pretreated with 10 &mgr;mol/L SP600125 30 min before being exposed to 200 mmol/L ethanol for 60 min. A: p-JNK1/2, t-JNK1/2, and IGF-IR activities; B: IGF-I concentration; C and D: IGF-I mRNA expression; E: Cell viability. β-actin (A) and GAPDH (C) were used as loading controls. The mRNA expression (as indicated by a band at 180 bp, C) was determined by densitometric analysis (D) of the amplification products. Data represent percentages relative to control. The cell viability (D) was determined by the MTT assay. aP < 0.05 vs control (n = 6).
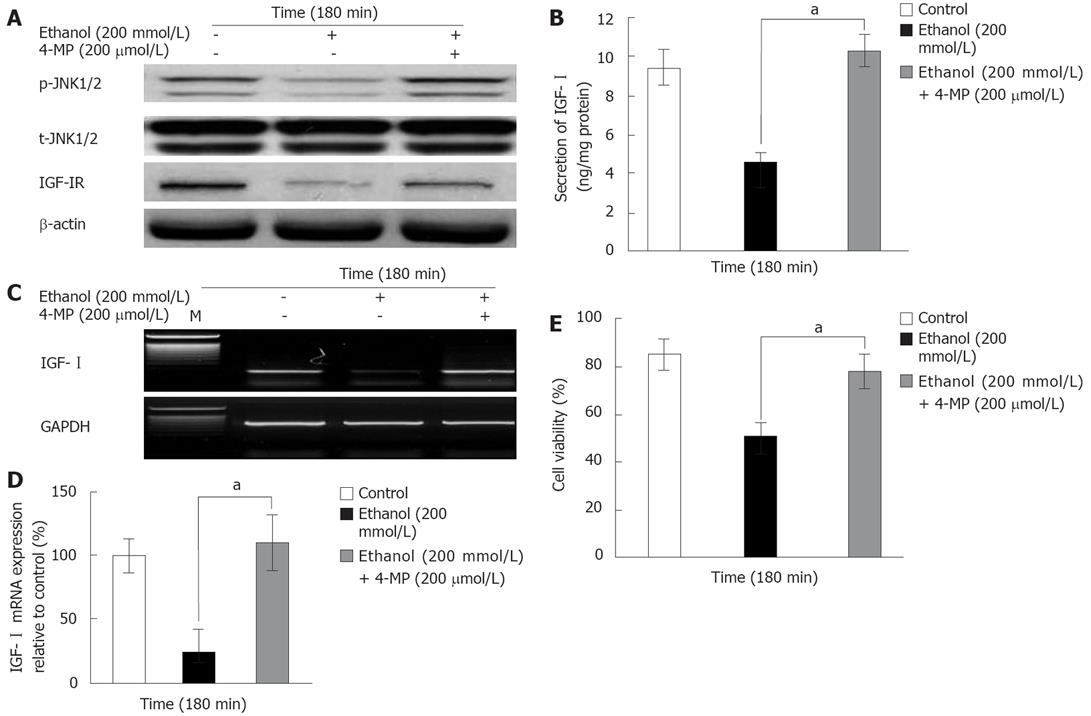
Figure 4 Effects of ADH inhibitor on the IGF-I system, cell viability, and JNK1/2 activity induced by ethanol at 180 min in primary cultured rat hepatocytes (mean ± SD).
The cells were pretreated with 200 &mgr;mol/L 4-MP 30 min before being exposed to 200 mmol/L ethanol for 180 min. A: p-JNK1/2, t-JNK1/2, and IGF-IR activities; B: IGF-I concentration; C and D: IGF-I mRNA expression; E: Cell viability. β-actin (A) and GAPDH (C) were used as loading controls. The mRNA expression (as indicated by a band at 180 bp, C) was determined by densitometric analysis (D) of the amplification products. Data represent percentages relative to control. The cell viability (D) was determined by the MTT assay. aP < 0.05 vs control (n = 6).
- Citation: Oh YI, Kim JH, Kang CW. Effects of ethanol on insulin-like growth factor-I system in primary cultured rat hepatocytes: Implications of JNK1/2 and alcoholdehydrogenase. World J Gastroenterol 2008; 14(27): 4324-4331
- URL: https://www.wjgnet.com/1007-9327/full/v14/i27/4324.htm
- DOI: https://dx.doi.org/10.3748/wjg.14.4324


