Copyright
©2008 The WJG Press and Baishideng.
World J Gastroenterol. Jul 14, 2008; 14(26): 4190-4195
Published online Jul 14, 2008. doi: 10.3748/wjg.14.4190
Published online Jul 14, 2008. doi: 10.3748/wjg.14.4190
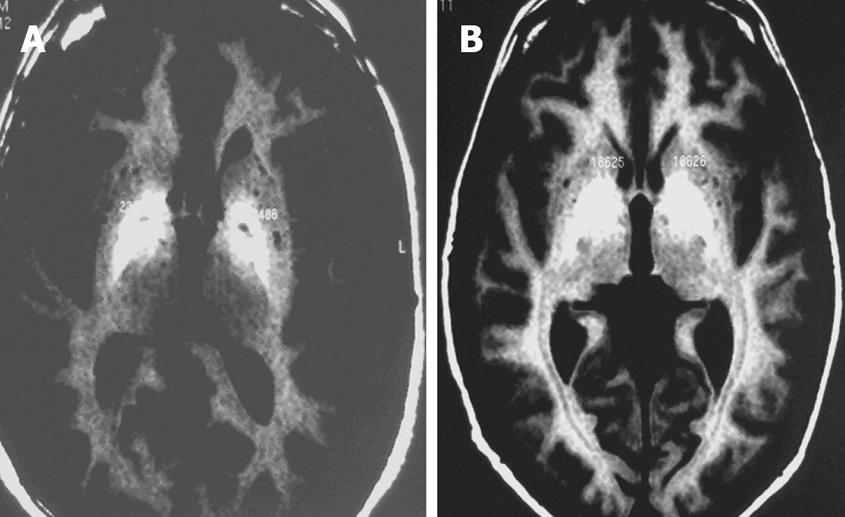
Figure 1 T1 MRI of basal ganglia in cirrhosis: mild (grade 1) signal increase (A) and severe (grade 2) signal increase (B).
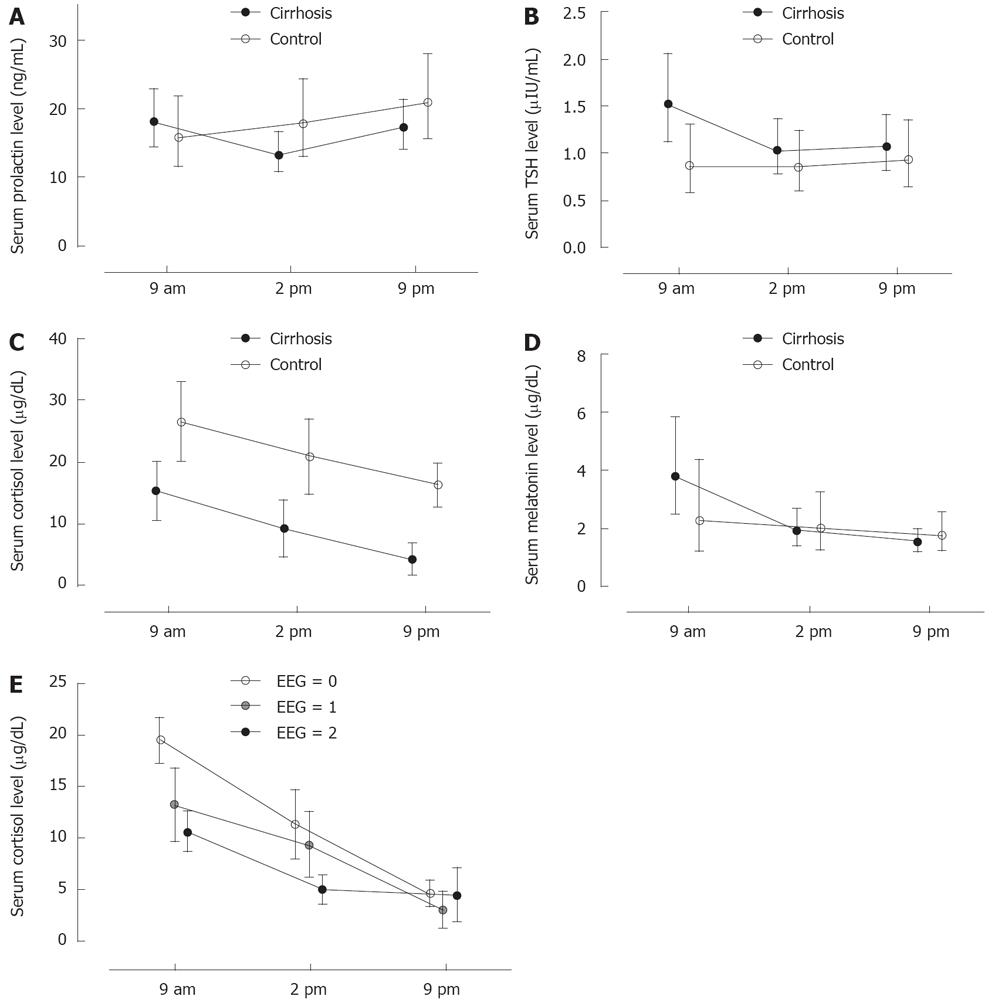
Figure 2 A: Prolactin levels in cirrhosis patients and controls; B: TSH levels in cirr-hosis patients and controls; C: Cortisol levels in cirrhosis patients and controls; D: Melatonin levels in cirrhosis patients and controls; E: Cortisol and severity of EEG abnormalities.
- Citation: Velissaris D, Karanikolas M, Kalogeropoulos A, Solomou E, Polychronopoulos P, Thomopoulos K, Labropoulou-Karatza C. Pituitary hormone circadian rhythm alterations in cirrhosis patients with subclinical hepatic encephalopathy. World J Gastroenterol 2008; 14(26): 4190-4195
- URL: https://www.wjgnet.com/1007-9327/full/v14/i26/4190.htm
- DOI: https://dx.doi.org/10.3748/wjg.14.4190


