Copyright
©2008 The WJG Press and Baishideng.
World J Gastroenterol. Jun 21, 2008; 14(23): 3750-3753
Published online Jun 21, 2008. doi: 10.3748/wjg.14.3750
Published online Jun 21, 2008. doi: 10.3748/wjg.14.3750
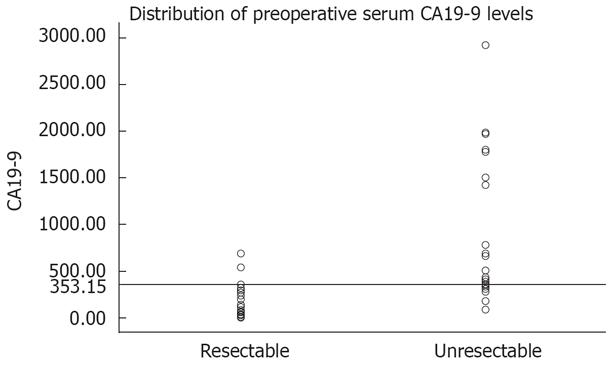
Figure 1 Distribution of preoperative serum CA19-9 levels.
The horizon marker is set according to the cut-off point of CA19-9 (353.15 U/mL).
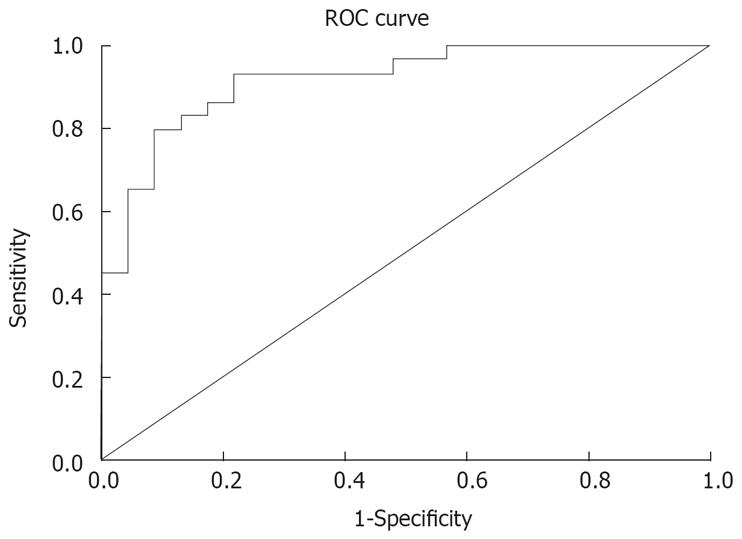
Figure 2 ROC analysis of CA19-9.
Perfect discrimination has a ROC plot passing through the upper left corner (100% sensitivity, 100% specificity). The closer the ROC plot to the upper left corner, the higher the overall accuracy of the test (AUC: 0.9-1 indicating excellent; 0.8-0.9 indicating very good; 0.7-0.8 indicating good; 0.6-0.7 indicating average; 0.5-0.6 indicating poor). The AUC of CA19-9 was 0.918.
- Citation: Zhang S, Wang YM, Sun CD, Lu Y, Wu LQ. Clinical value of serum CA19-9 levels in evaluating resectability of pancreatic carcinoma. World J Gastroenterol 2008; 14(23): 3750-3753
- URL: https://www.wjgnet.com/1007-9327/full/v14/i23/3750.htm
- DOI: https://dx.doi.org/10.3748/wjg.14.3750


