Copyright
©2008 The WJG Press and Baishideng.
World J Gastroenterol. Jun 21, 2008; 14(23): 3745-3749
Published online Jun 21, 2008. doi: 10.3748/wjg.14.3745
Published online Jun 21, 2008. doi: 10.3748/wjg.14.3745
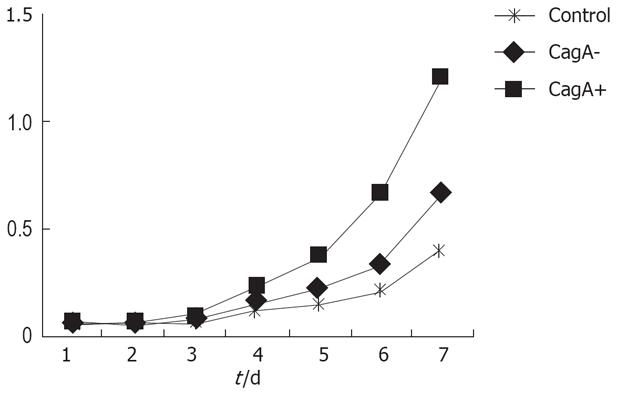
Figure 1 Cell proliferation determined by MTT assay.
P < 0.05, CagA+ vs control and CagA+ vs CagA-.
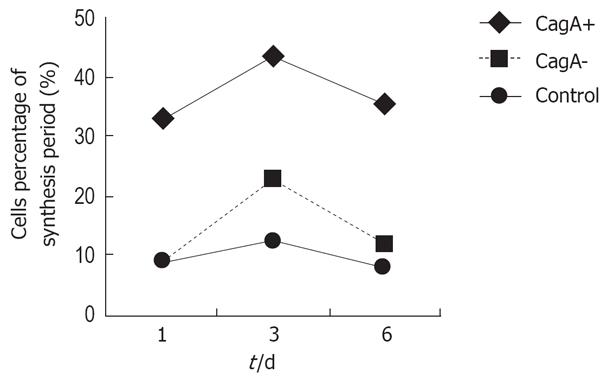
Figure 2 S-phase cells.
P < 0.05, CagA+ vs CagA-.
Figure 3 DNA damage measured by single-cell microgel electrophoresis.
A: Comet tails in control group; B: Comet tails in CagA- group; C: Comet tails in CagA+ group.
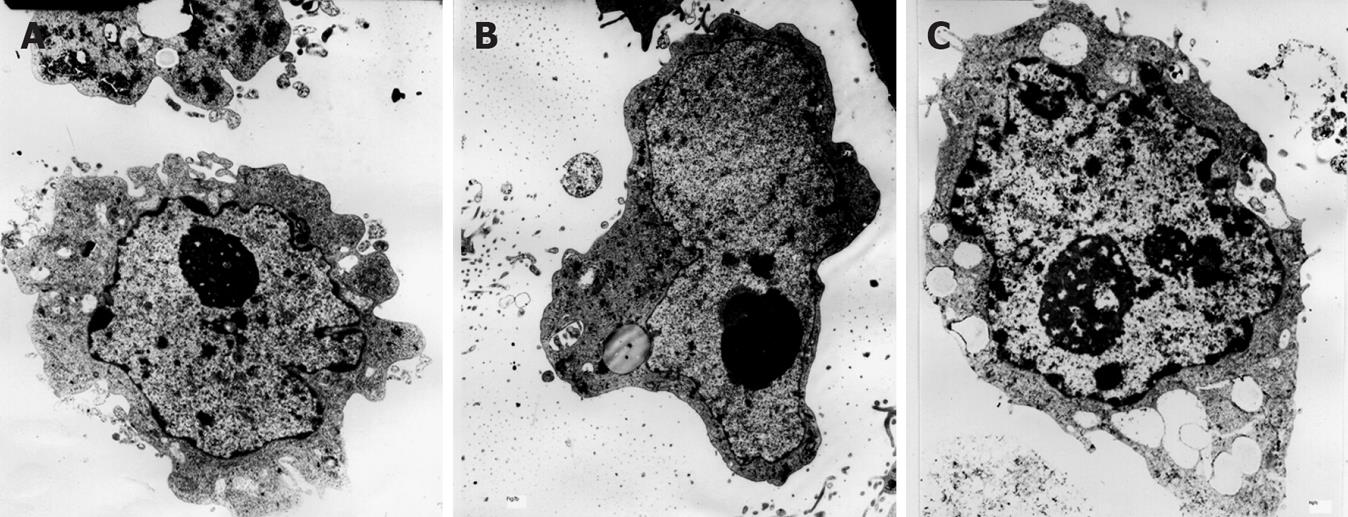
Figure 4 GES-1 treated with different H pylori filtrates.
A: Control group; B: CagA-group; C: CagA+ group.
-
Citation: Yan YG, Zhao G, Ma JP, Cai SR, Zhan WH. Effects of different
Helicobacter pylori culture filtrates on growth of gastric epithelial cells. World J Gastroenterol 2008; 14(23): 3745-3749 - URL: https://www.wjgnet.com/1007-9327/full/v14/i23/3745.htm
- DOI: https://dx.doi.org/10.3748/wjg.14.3745


