Copyright
©2008 The WJG Press and Baishideng.
World J Gastroenterol. Jun 14, 2008; 14(22): 3534-3540
Published online Jun 14, 2008. doi: 10.3748/wjg.14.3534
Published online Jun 14, 2008. doi: 10.3748/wjg.14.3534
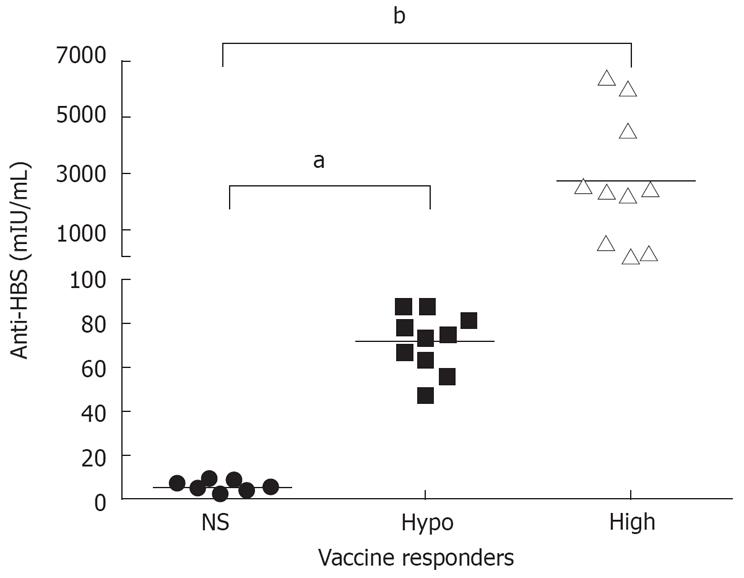
Figure 1 Comparison of anti-HBs levels from vaccine non-responders (NS), hyporesponders (Hypo) and high-responders (High) after booster HBV vaccination.
aP < 0.05; bP = 0.001.
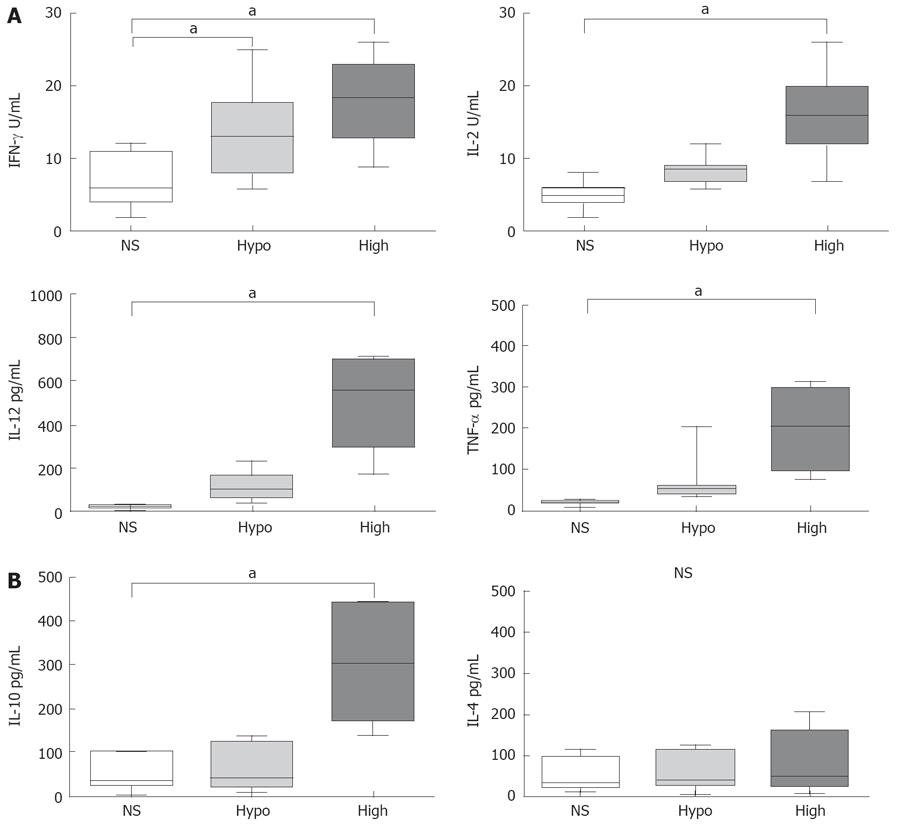
Figure 2 Cytokine secreted by PBMC’s from high-responders, hypo-responders and non-responder adults after in vitro stimulation with HBsAg.
A: Comparison of Th1 cytokines (IFN-γ, IL-2, TNF-α, and IL-12) between the three groups of vaccine responders; B: Comparison of Th2 cytokines (IL-10 and IL-4) between the three groups of vaccine responders. aP < 0.05.
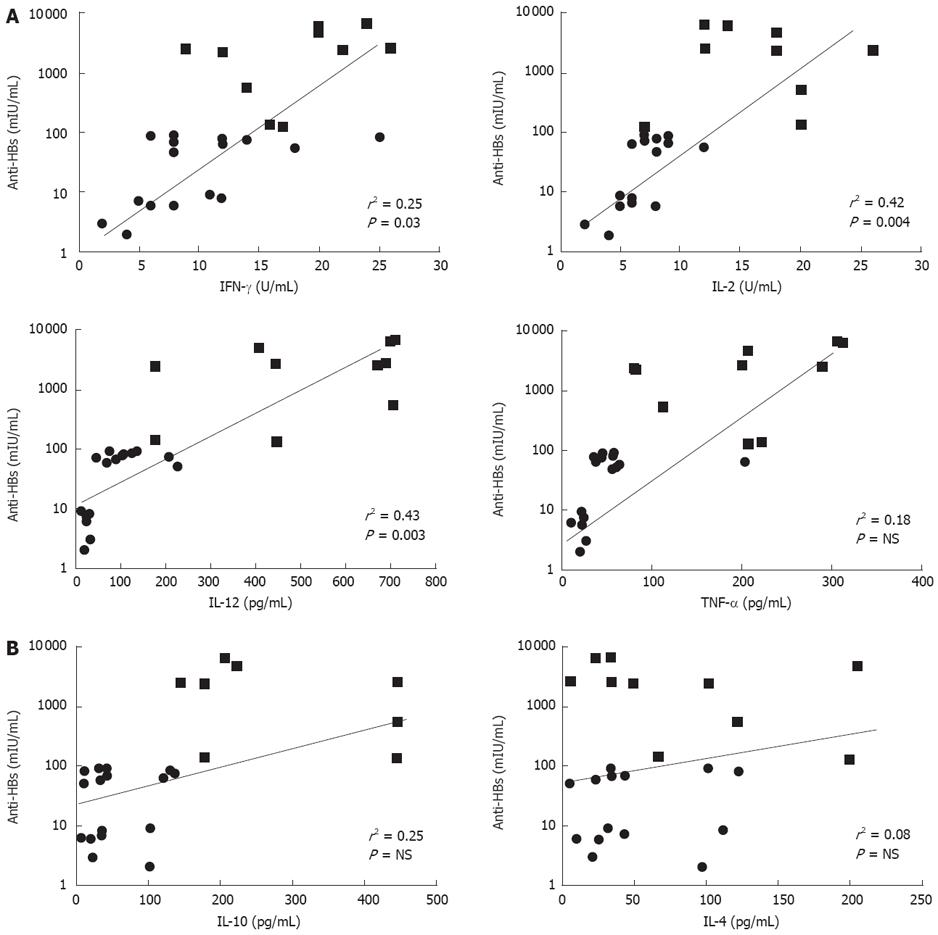
Figure 3 Correlation between anti-HBs titers and cytokine levels secreted after in vitro stimulation of PBMC with HBsAg from high-responder, hypo-responder and non-responder adults.
A: Correlation of anti-HBs antibody response and the Th1 cytokine (IFN-γ, IL-2, IL-12 and TNF-α) response to HBsAg; B: Correlation of anti-HBs antibody response and the Th2 cytokine (IL-10 and IL-4) response to HBsAg.
- Citation: Velu V, Saravanan S, Nandakumar S, Shankar EM, Vengatesan A, Jadhav SS, Kulkarni PS, Thyagarajan SP. Relationship between T-lymphocyte cytokine levels and sero-response to hepatitis B vaccines. World J Gastroenterol 2008; 14(22): 3534-3540
- URL: https://www.wjgnet.com/1007-9327/full/v14/i22/3534.htm
- DOI: https://dx.doi.org/10.3748/wjg.14.3534


