Copyright
©2008 The WJG Press and Baishideng.
World J Gastroenterol. Jun 14, 2008; 14(22): 3526-3533
Published online Jun 14, 2008. doi: 10.3748/wjg.14.3526
Published online Jun 14, 2008. doi: 10.3748/wjg.14.3526
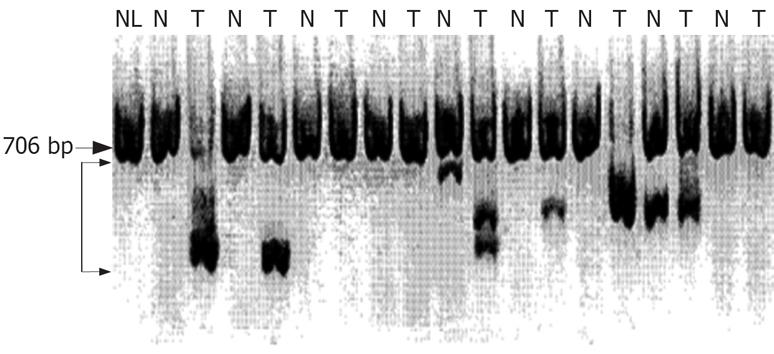
Figure 1 Analysis of mRNA expression of FHIT gene in matched surrounding non-cancerous and cancerous tissues by RT-PCR.
Large arrow: Normal sized FHIT cDNA (706 bp); small arrows: Aberrant transcripts (458 bp, 413 bp, 389 bp, 365 bp, and 296 bp); NL: Normal liver tissue; T: Tumor tissue; N: Non-tumor liver tissue.
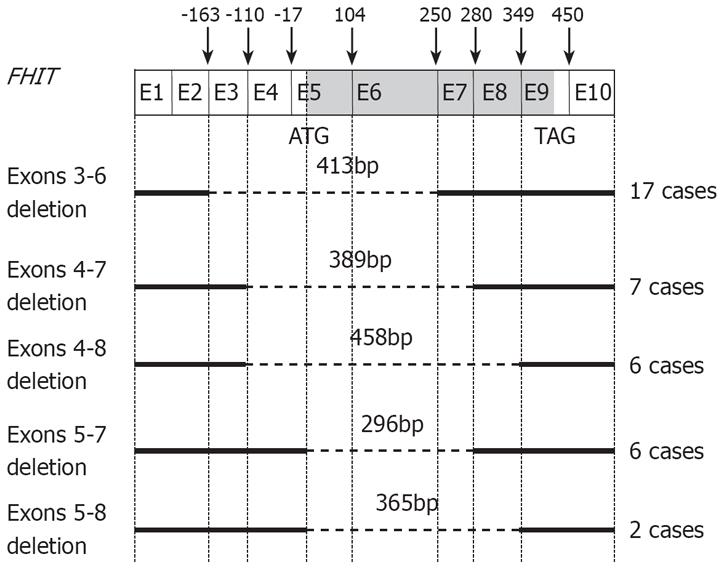
Figure 2 Schematic representation of aberrant FHIT transcripts in HCC tissues.
Sequence analysis of aberrant transcripts reveals deletions of exons 3-6 (nt-164 to 249) in 17 cases, exons 4-7 (nt-110 to 279) in 7 cases, exons 4-8 (nt-110 to 348) in 6 cases, exons 5-7 (nt-17 to 279) in 6 cases, and exons 5-8 (nt-17 to 348) in 2 cases.
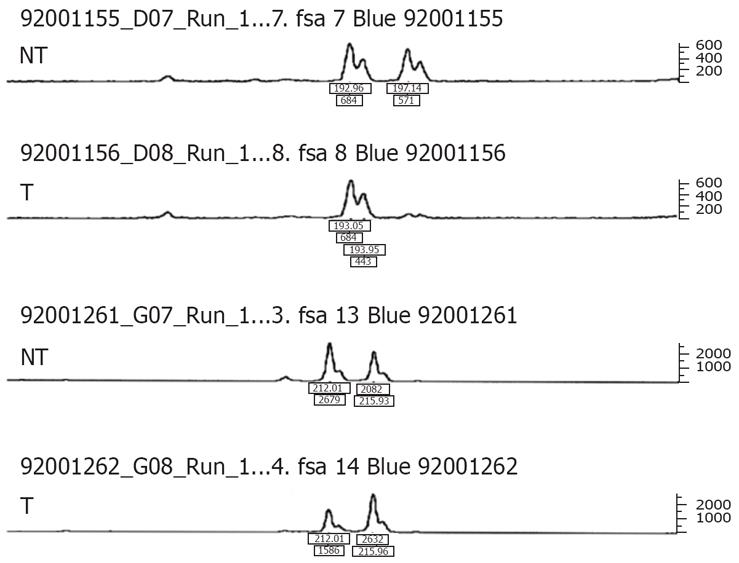
Figure 3 LOH of FHIT locus.
An example of LOH in tumor (T) and matched non-tumorous (NT) DNA from patients with HCC. LOH is defined as if the signal of one allele is lost or reduced to at least 50% in tumor DNA, compared to the corresponding normal allele.
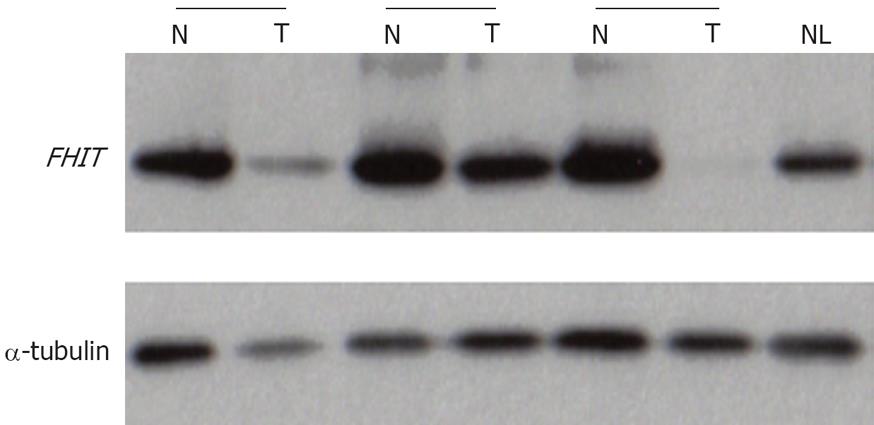
Figure 4 Representative results of Fhit expression by Western blot analysis.
α-tubulin is used as the internal control to verify equal loading. The relative values of FHIT protein were normalized internally to α-tubulin signals. NL: Normal liver tissue; N: Non-cancerous tissue; T: Tumor tissue.
- Citation: Nam CW, Shin JW, Park NH. Fragile histidine triad gene alterations are not essential for hepatocellular carcinoma development in South Korea. World J Gastroenterol 2008; 14(22): 3526-3533
- URL: https://www.wjgnet.com/1007-9327/full/v14/i22/3526.htm
- DOI: https://dx.doi.org/10.3748/wjg.14.3526


