Copyright
©2008 The WJG Press and Baishideng.
World J Gastroenterol. May 28, 2008; 14(20): 3242-3248
Published online May 28, 2008. doi: 10.3748/wjg.14.3242
Published online May 28, 2008. doi: 10.3748/wjg.14.3242
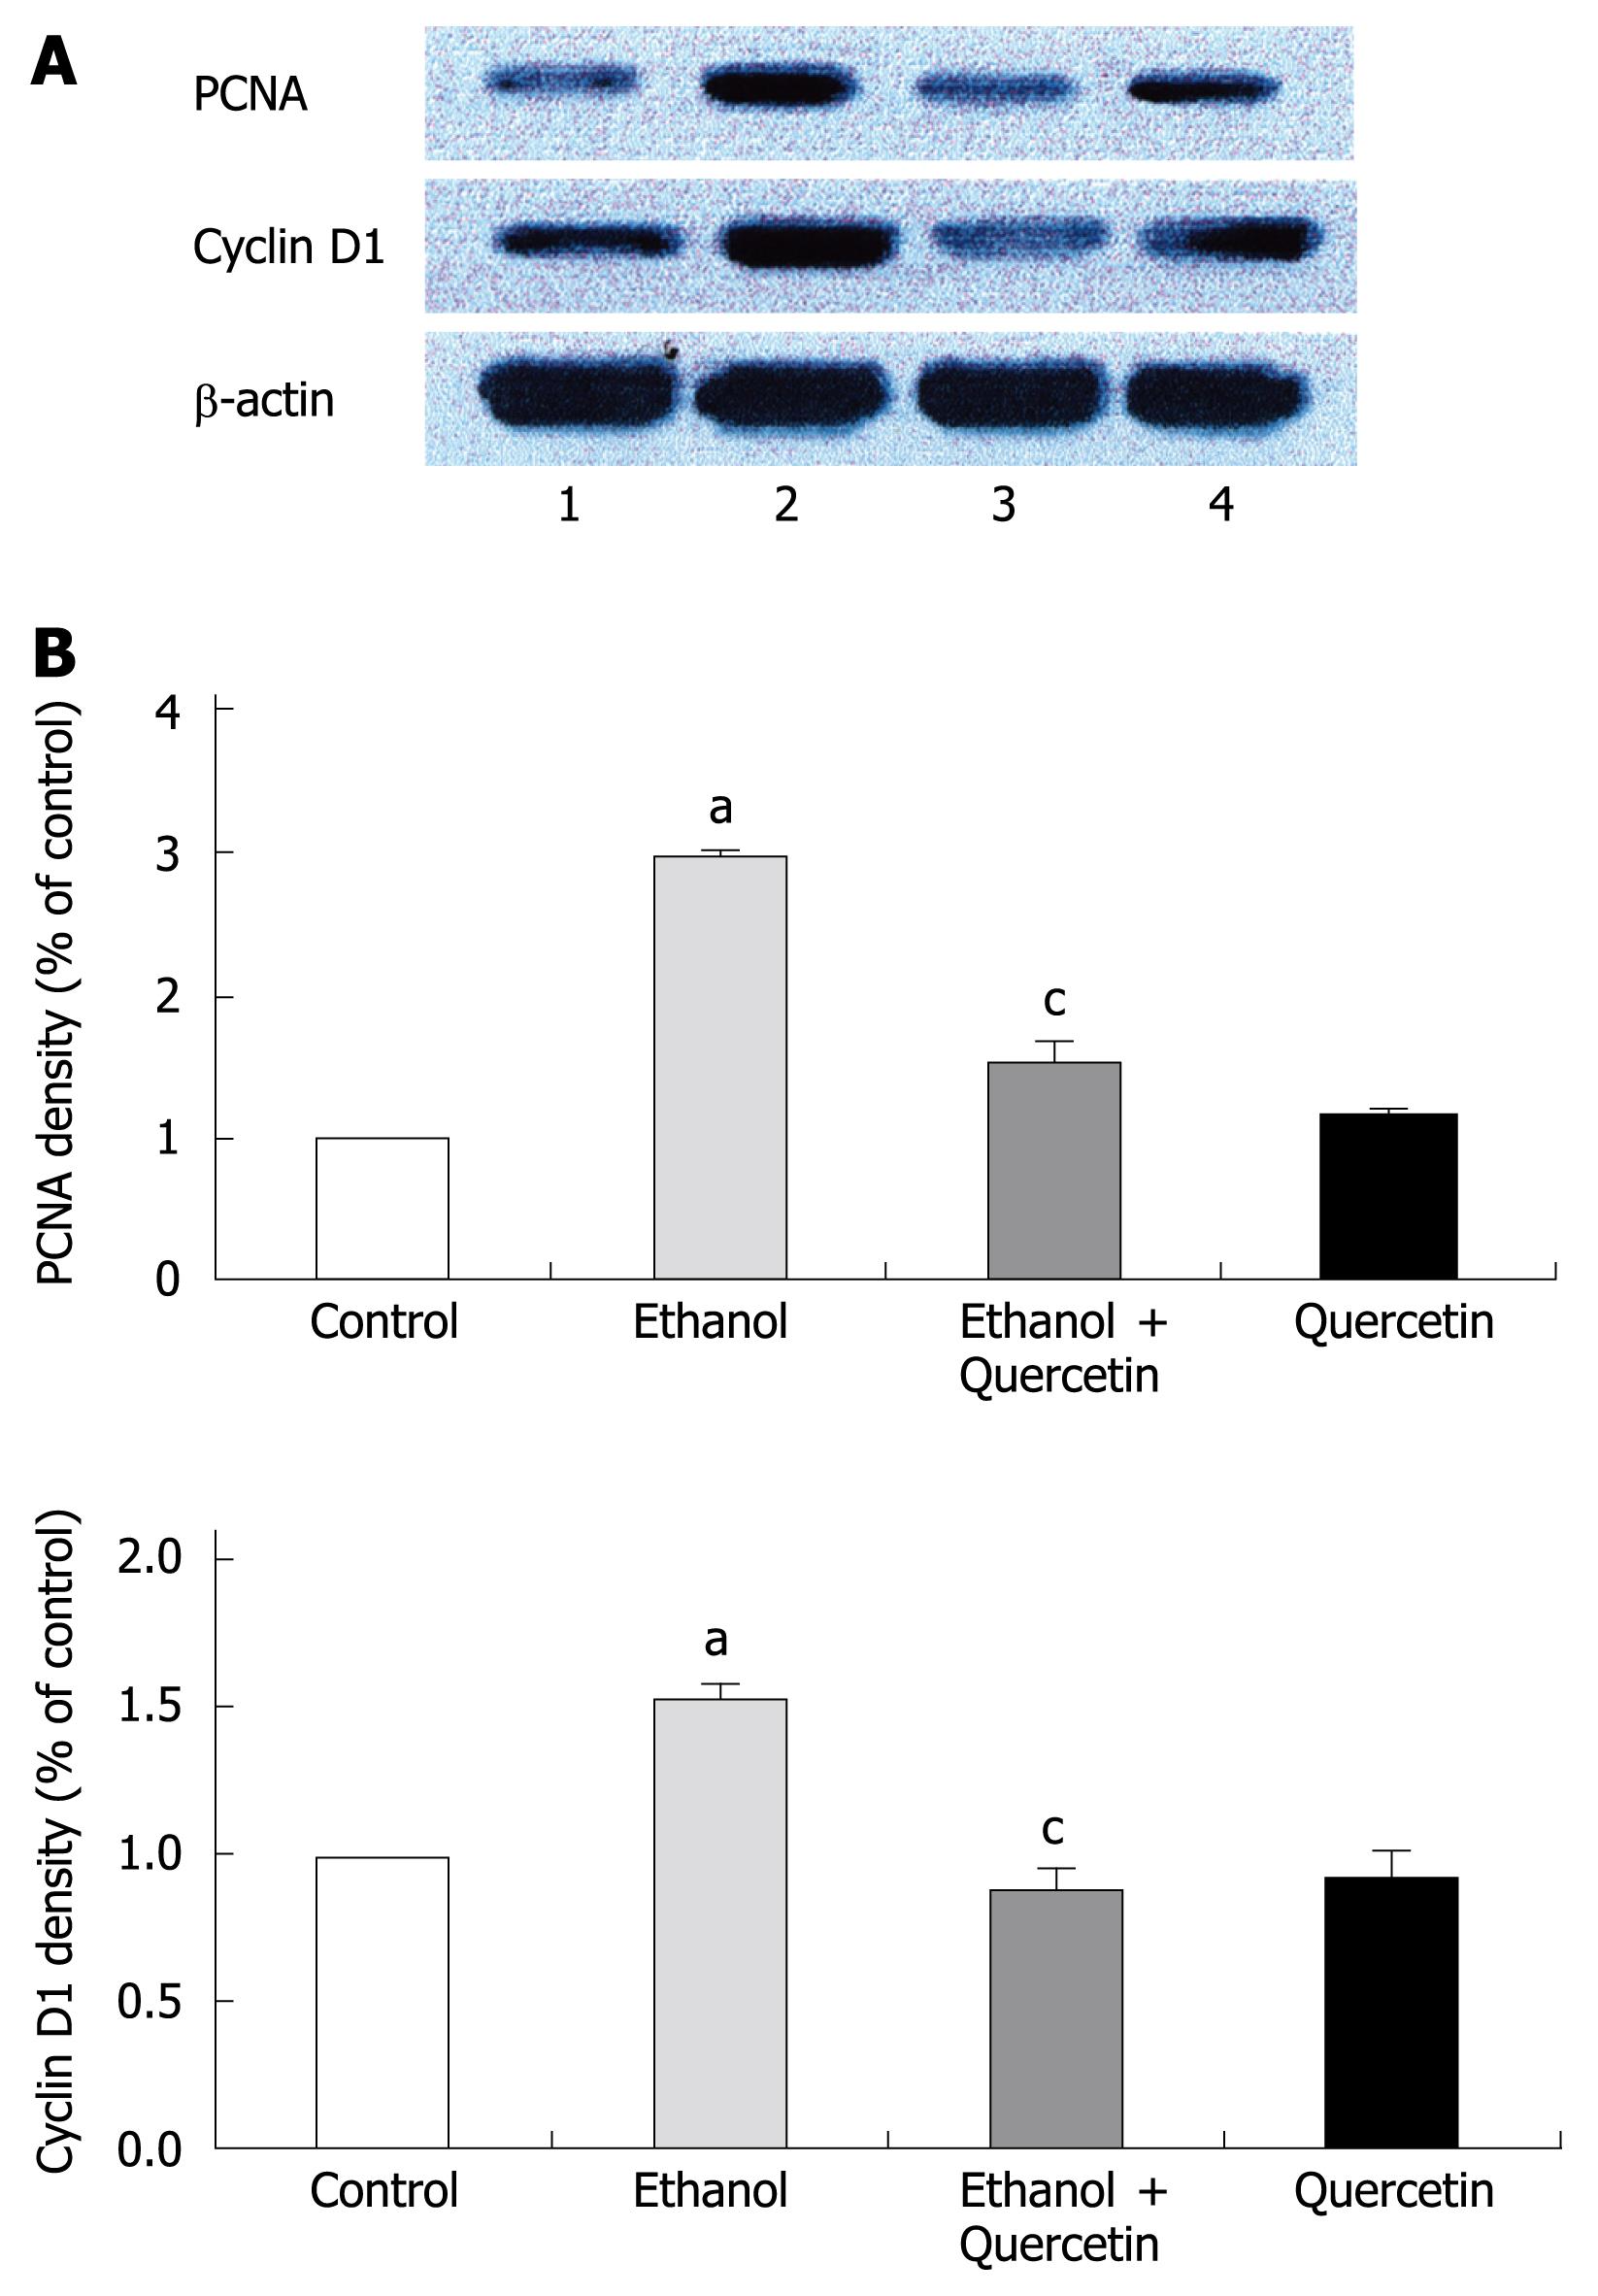
Figure 1 Immunoblotting of nuclear extracts from gastric mucosa with antibodies to PCNA and Cyclin D1 in the 4 groups as indicated in lanes 1-4 (A) and values normalized by arbitrarily setting the densitometry of control to 1.
0 (B). β-actin staining was performed to ensure an equal loading. The results indicated are in percentage above the control value and are representative of four independent experiments. aP < 0.05 vs control animals, cP < 0.05 vs ethanol-treated animals.
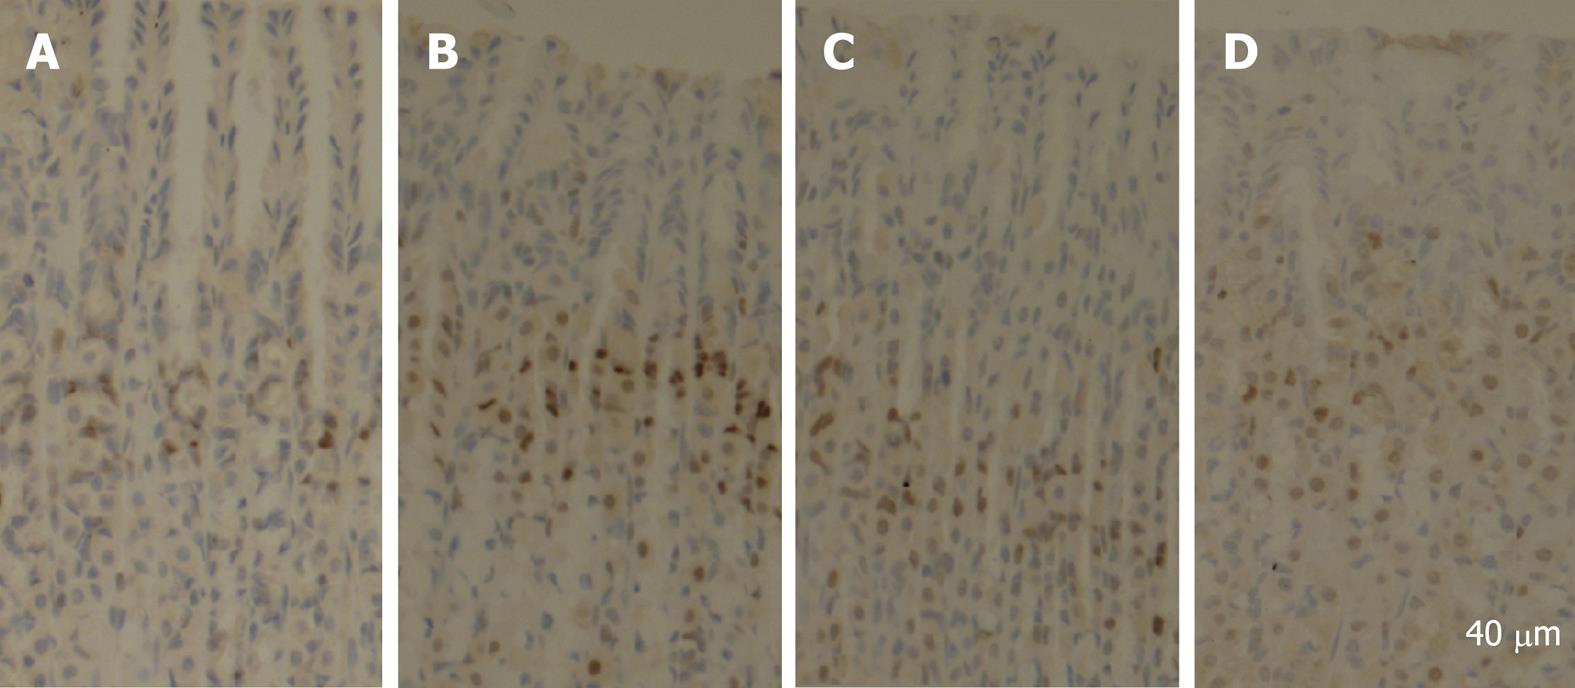
Figure 2 Staining of PCNA from rats in the 4 groups, respectively (A-D).
Stem cells at the neck position were positively stained, while other cells were negatively stained. A significantly increased number of PCNA positive cells were observed in the fundic gland of rats treated with ethanol for 7 d. A: Control; B: Ethanol; C: Ethanol + Quercetin; D: Quercetin.
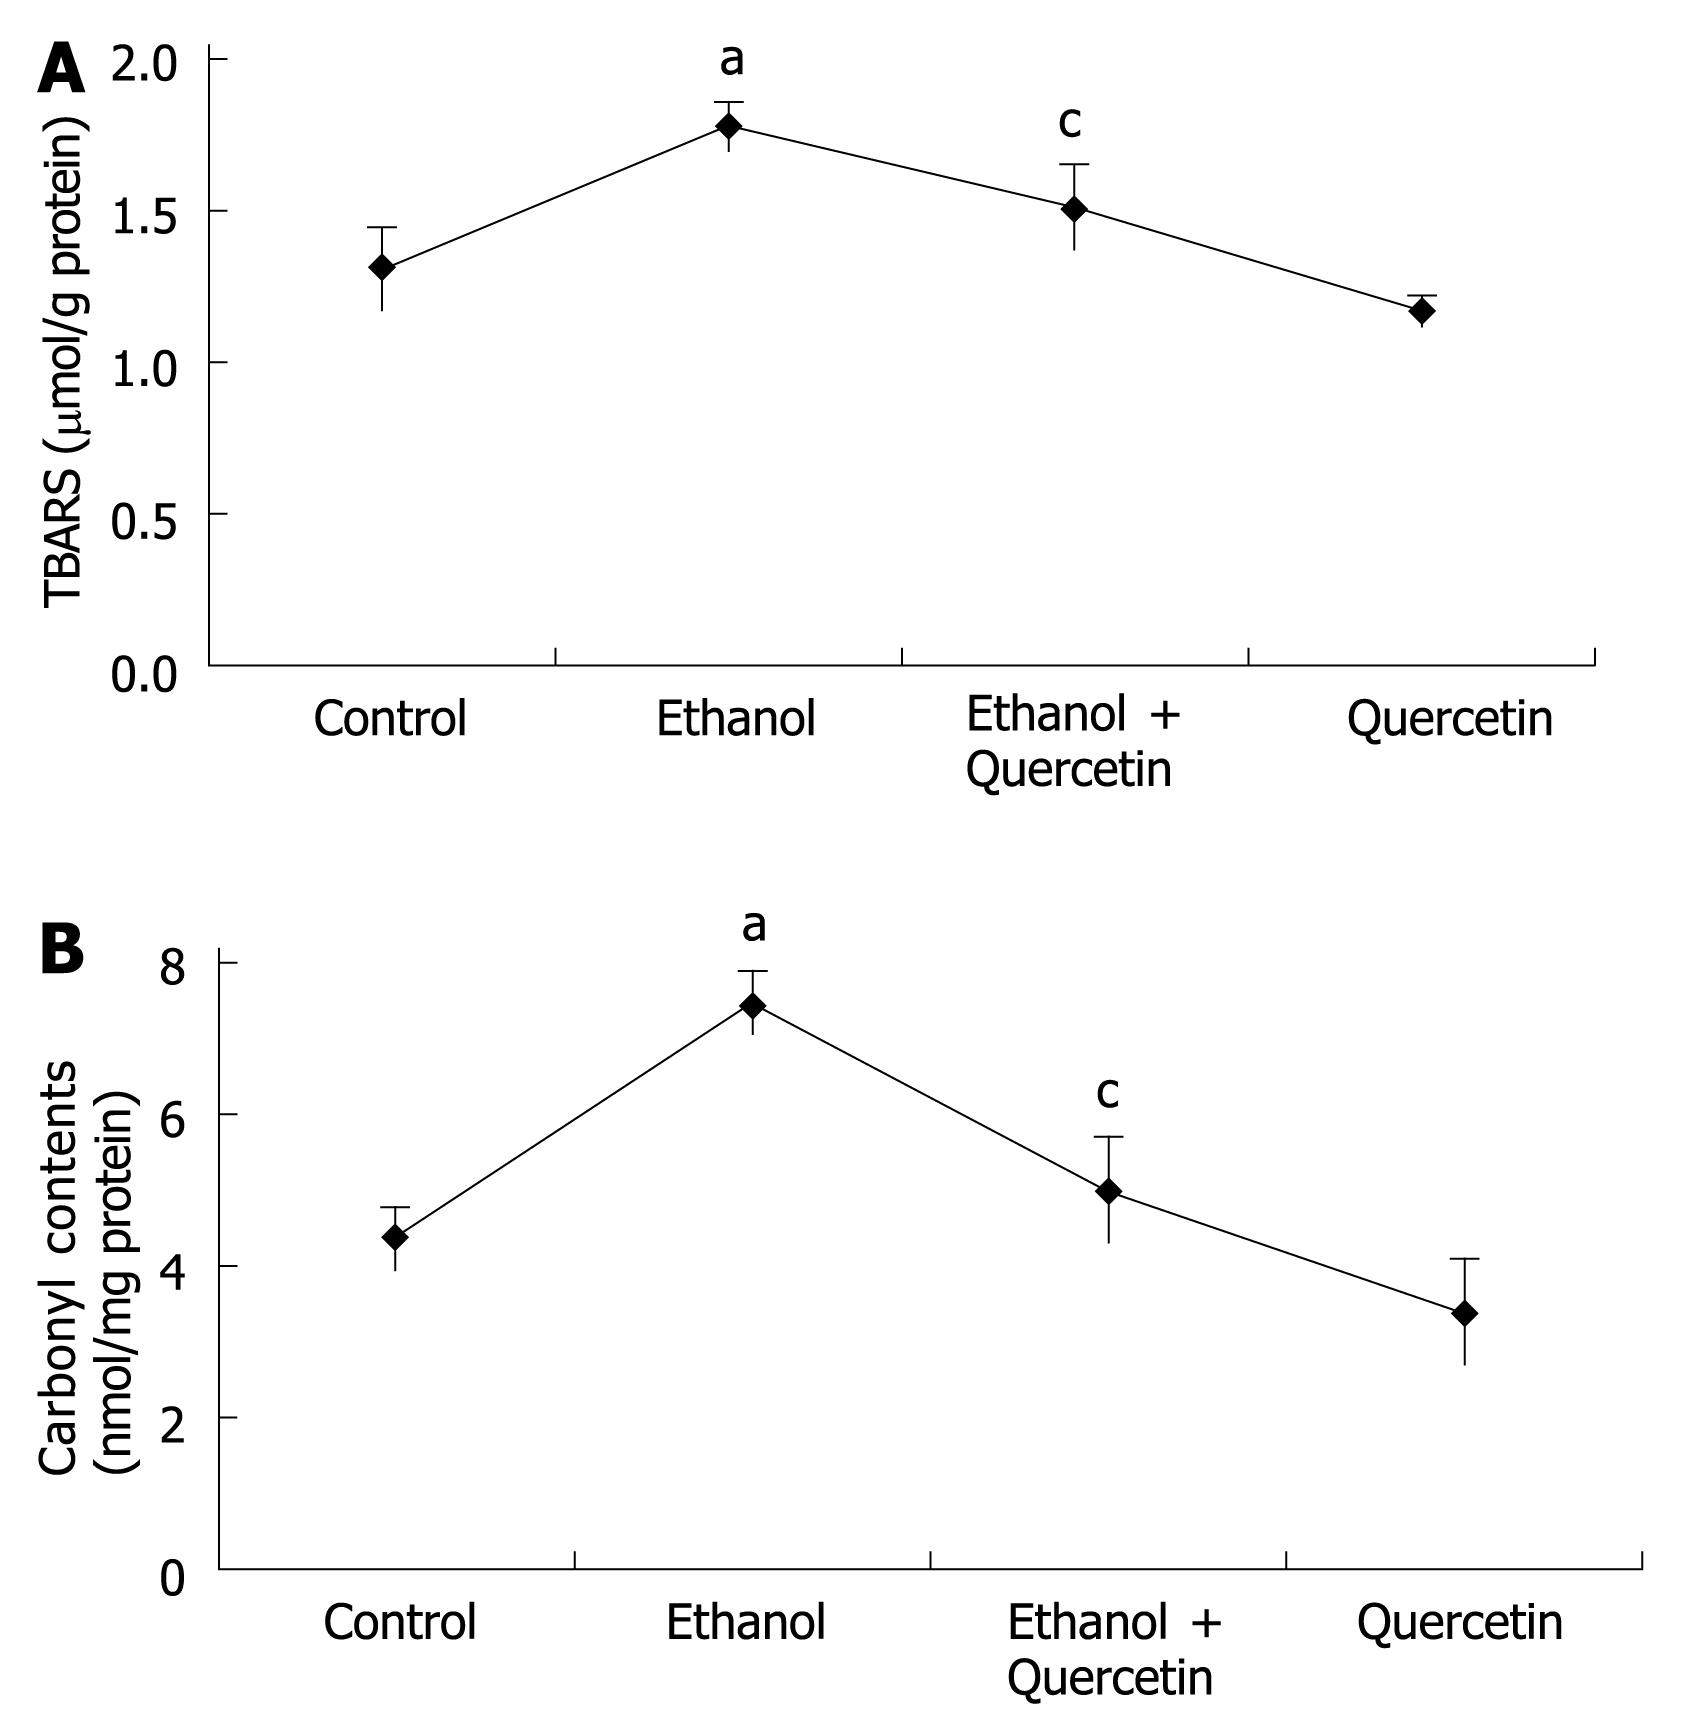
Figure 3 Lipid peroxidation (A) and protein oxidation (B) determined in gastric mucosa of rats after treatment with different agents.
The data are expressed as mean ± SD of four independent experiments. aP < 0.05 vs control animals, cP < 0.05 vs ethanol-treated animals.
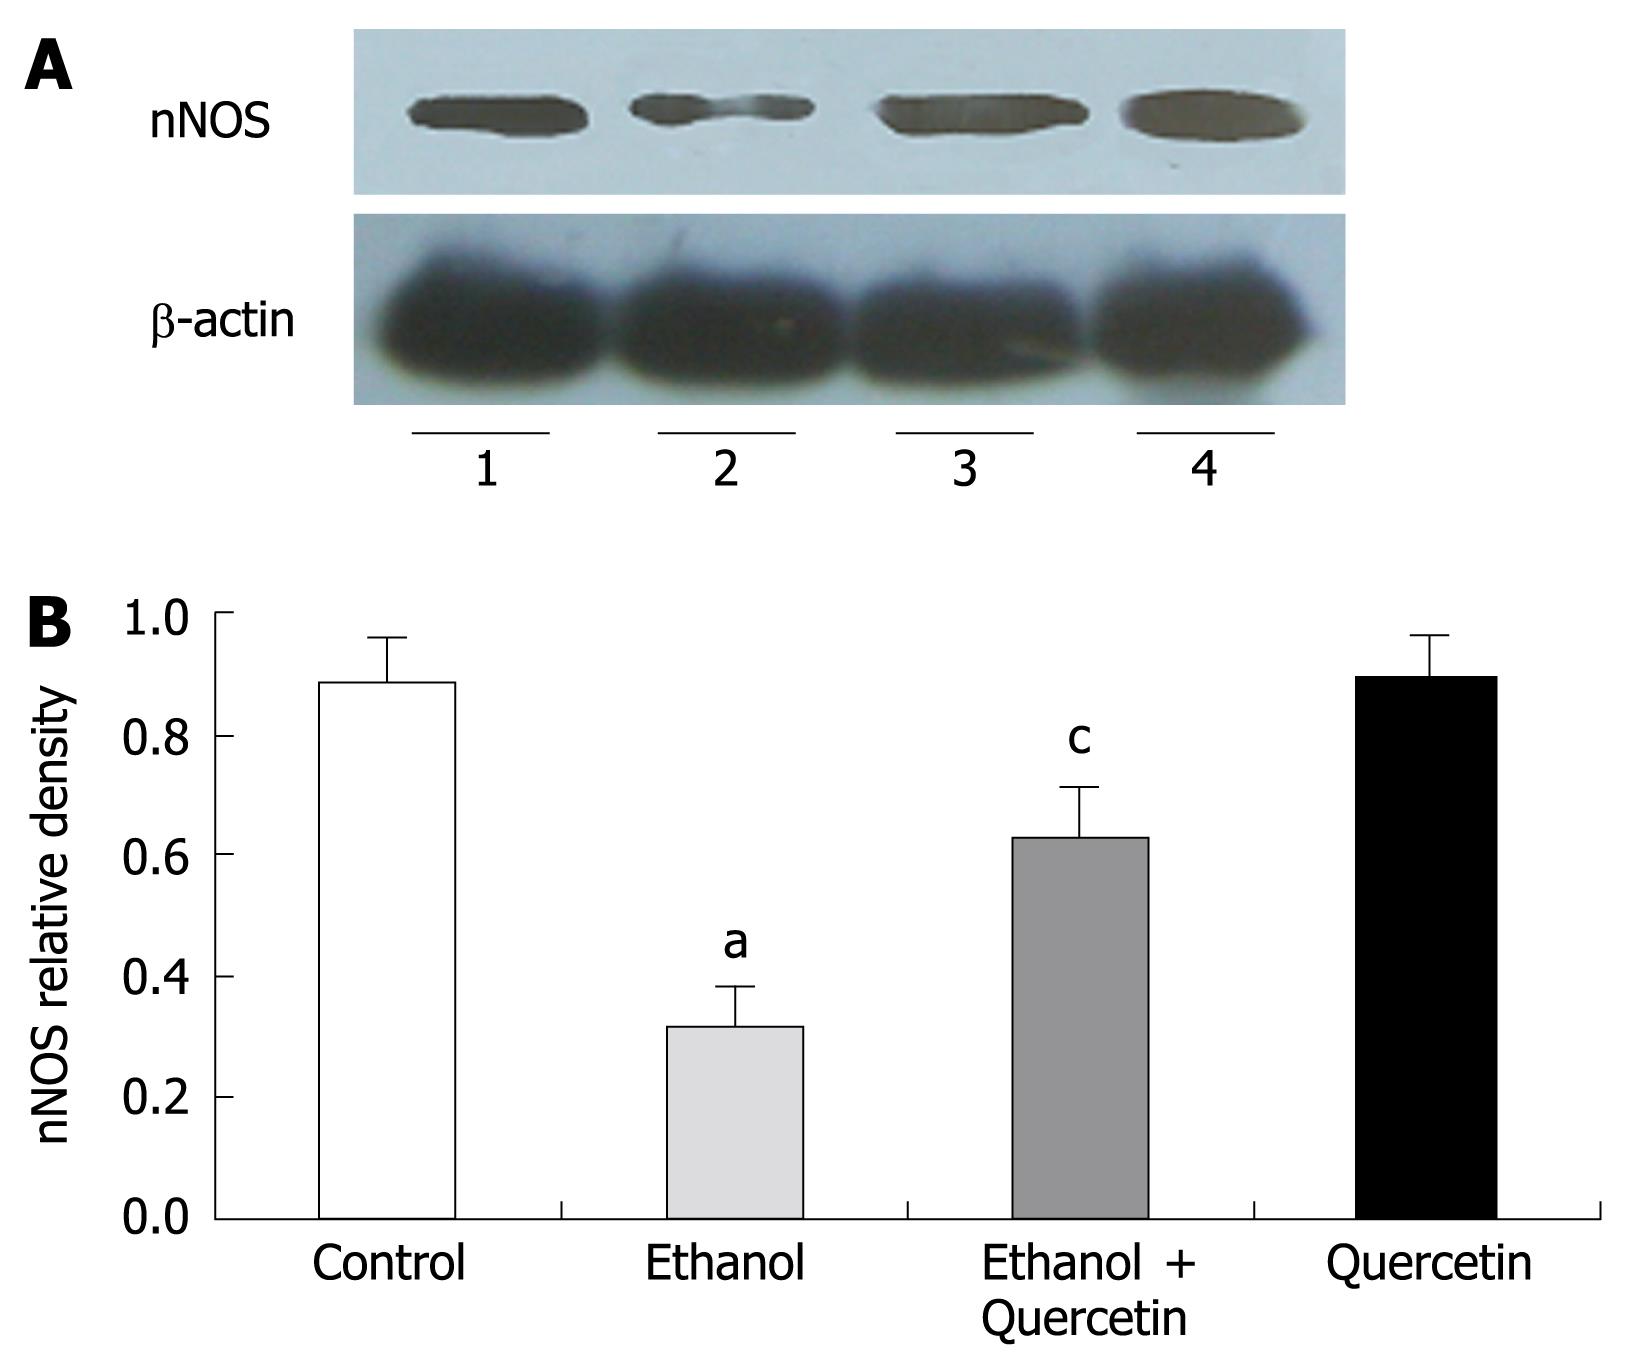
Figure 4 Immunoblotting of gastric homogenate with the antibody to nNOS in different treatment groups as indicated in lanes 1-4 (A) and values normalized by arbitrarily setting the densitometry of actin (B).
The results indicated are in percentage above the control value and are representative of the four independent experiments. aP < 0.05 vs control animals, cP < 0.05 vs ethanol-treated animals.
- Citation: Liu JL, Du J, Fan LL, Liu XY, Gu L, Ge YB. Effects of quercetin on hyper-proliferation of gastric mucosal cells in rats treated with chronic oral ethanol through the reactive oxygen species-nitric oxide pathway. World J Gastroenterol 2008; 14(20): 3242-3248
- URL: https://www.wjgnet.com/1007-9327/full/v14/i20/3242.htm
- DOI: https://dx.doi.org/10.3748/wjg.14.3242


