Copyright
©2008 The WJG Press and Baishideng.
World J Gastroenterol. May 21, 2008; 14(19): 3038-3043
Published online May 21, 2008. doi: 10.3748/wjg.14.3038
Published online May 21, 2008. doi: 10.3748/wjg.14.3038
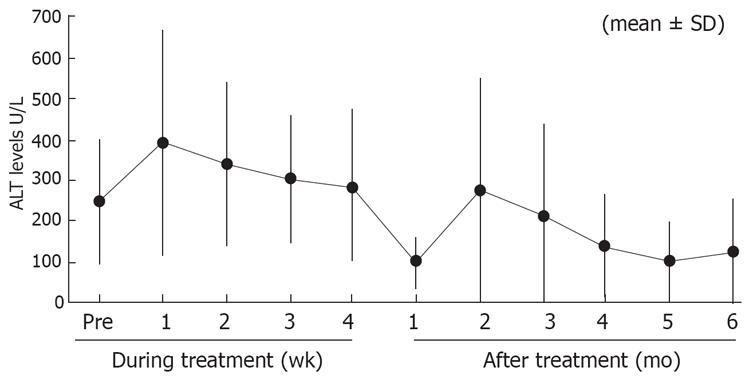
Figure 1 Change in ALT levels during treatment with interferon-β and during the follow-up.
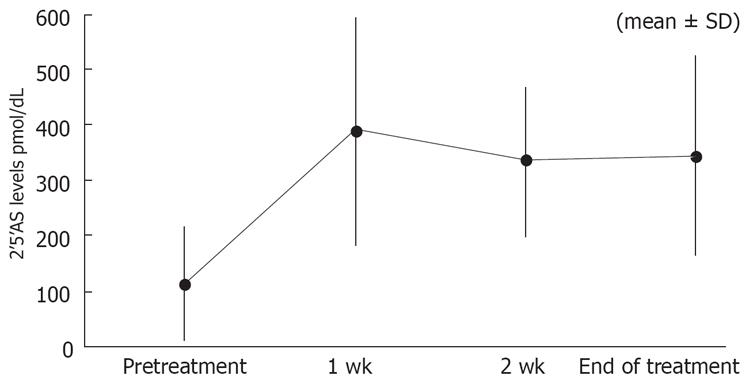
Figure 2 Change in 2’5’AS levels during treatment.
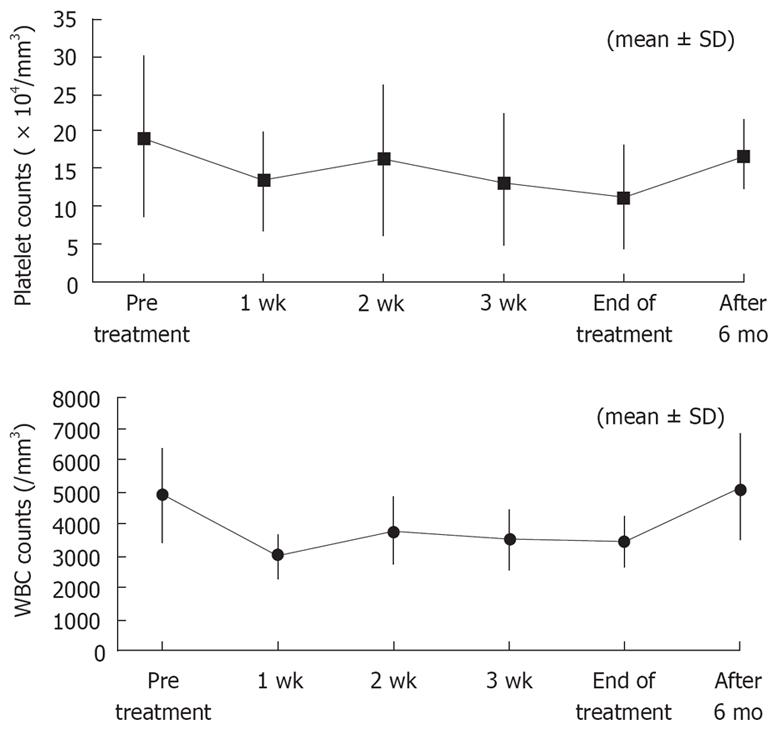
Figure 3 Changes in platelet and WBC counts.
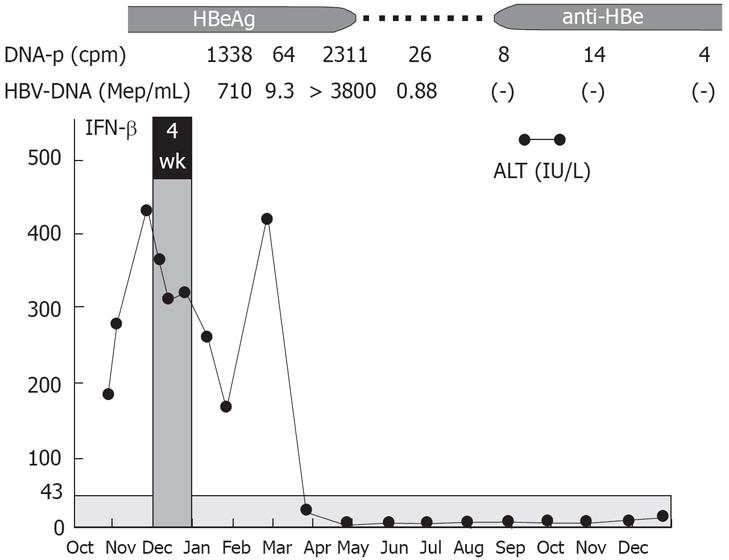
Figure 4 Typical pattern of clinical course with transient increase in ALT level after treatment with interferon-β.
- Citation: Okushin H, Ohnishi T, Morii K, Uesaka K, Yuasa S. Short-term intravenous interferon therapy for chronic hepatitis B. World J Gastroenterol 2008; 14(19): 3038-3043
- URL: https://www.wjgnet.com/1007-9327/full/v14/i19/3038.htm
- DOI: https://dx.doi.org/10.3748/wjg.14.3038


