Copyright
©2008 The WJG Press and Baishideng.
World J Gastroenterol. May 14, 2008; 14(18): 2825-2831
Published online May 14, 2008. doi: 10.3748/wjg.14.2825
Published online May 14, 2008. doi: 10.3748/wjg.14.2825
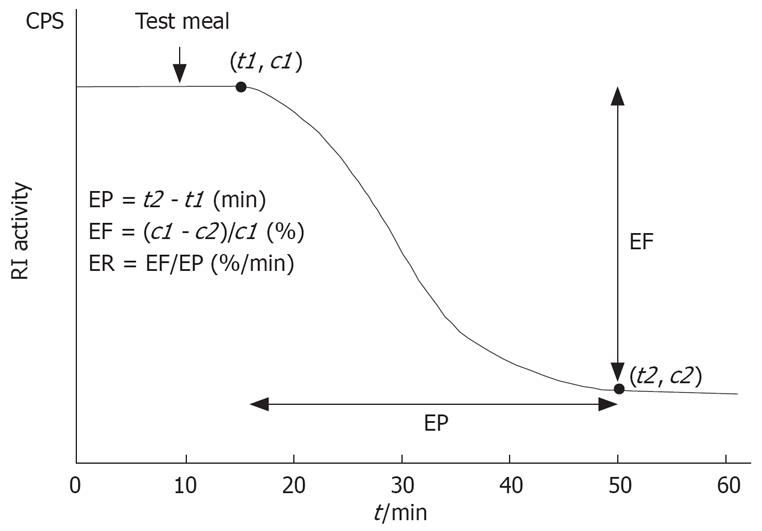
Figure 1 Definition of postprandial contractility indices of the gallbladder.
Postprandial gallbladder contractility was expressed by EF, which is determined as a percentage decrease in radioactivity, and ER, which is determined by EF/EP. Radioactivity was measured in three regions of interest in the gallbladder and EP was determined as the time of decrease on the time-activity curve. CPS: Counts per second.
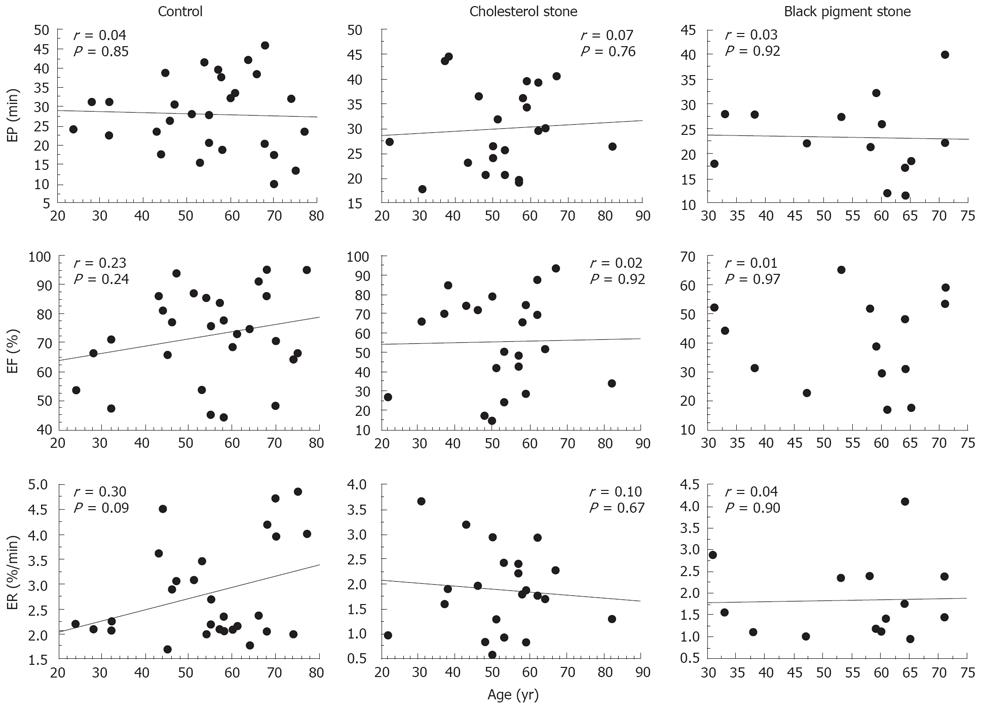
Figure 2 Correlation of age with contractility indices of the gallbladder.
There was no correlation between age and EP, EF and ER in all three groups.
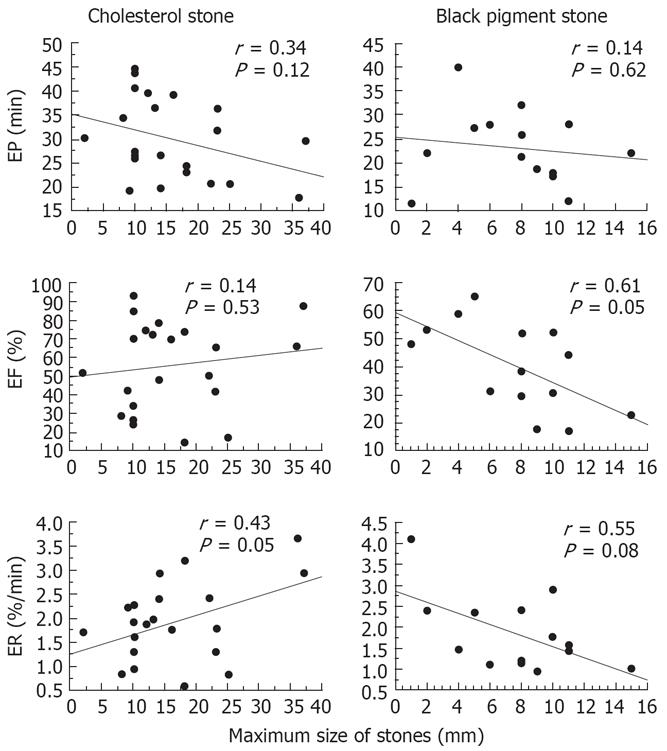
Figure 3 Correlation of the size of stones with contractility indices of the gallbladder.
There was no correlation between stone size and EP, EF and ER in all groups.
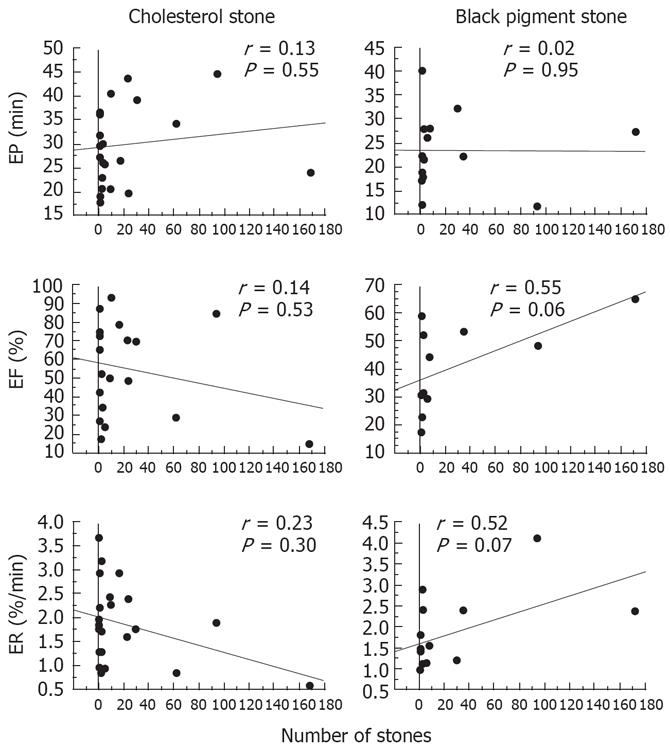
Figure 4 Correlation between the number of stones with the contractility indices of the gallbladder.
There was no correlation between the number of stones and EP, EF and ER in all groups.
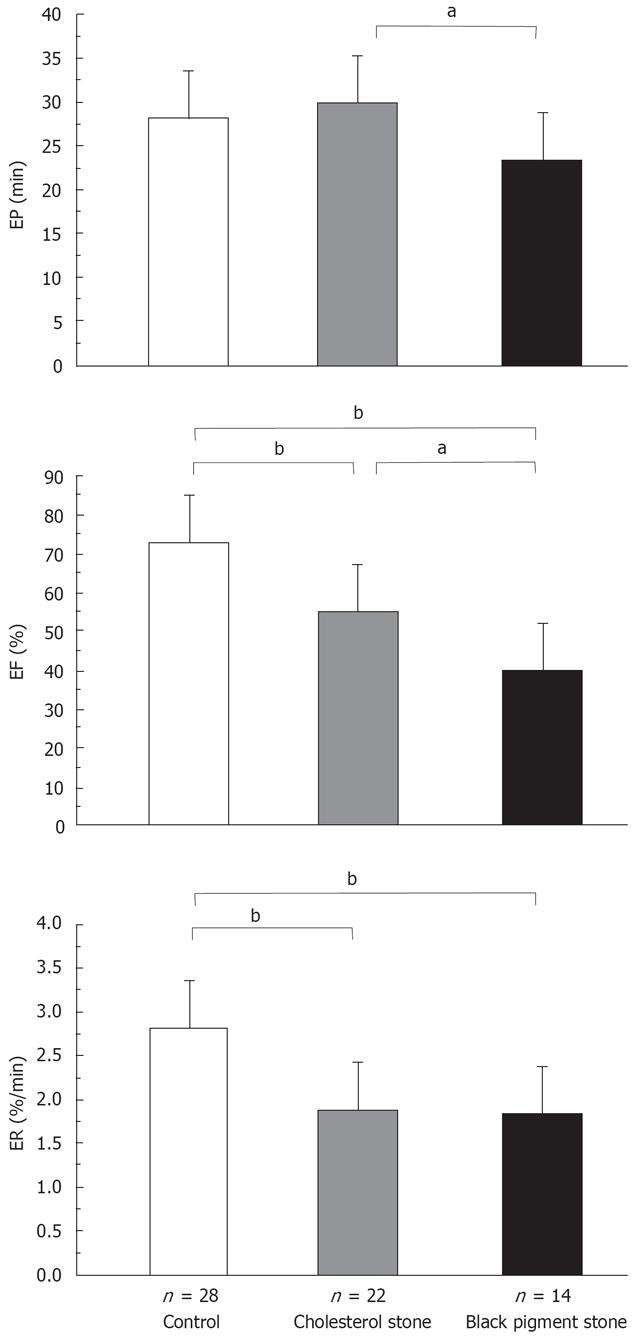
Figure 5 Postprandial contractility indices of the gallbladder.
A significantly shorter EP was observed in patients with BPSs than in those with CSs. EF in BPS patients was significantly decreased in comparison to that in CS patients and normal subjects. EF in CS patients also significantly decreased in comparison to that in normal subjects. Consequently, ER in patients with BPSs and CSs was significantly smaller than that in normal subjects. aP < 0.05, bP < 0.01.
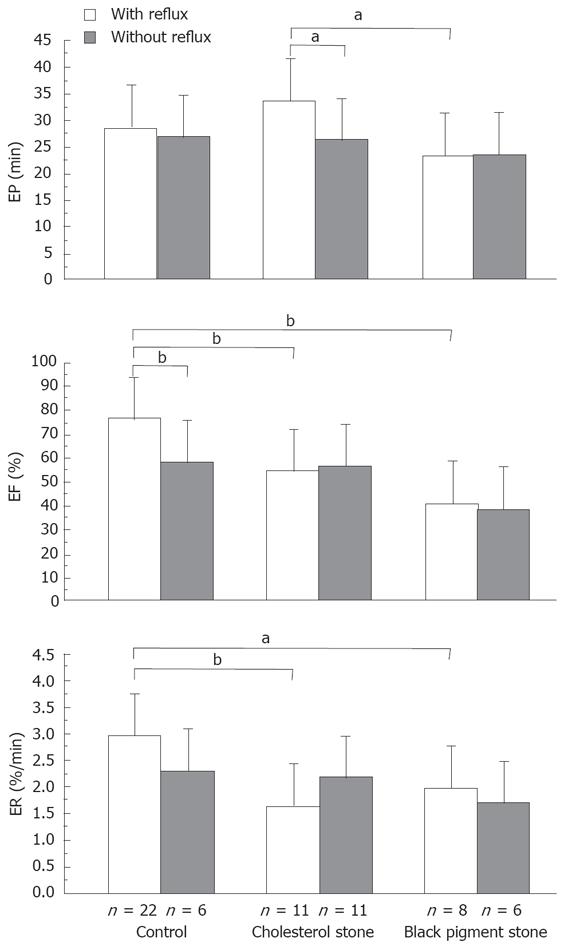
Figure 6 Postprandial contractility indices of the gallbladder according to the reflux state of a radioisotope into the common hepatic duct.
In normal subjects, EF was significantly larger in patients with reflux. In a subgroup analysis of such patients, EF and ER in those with either CSs or BPSs showed a significant reduction in comparison to those in normal subjects. aP < 0.05, bP < 0.01.
- Citation: Sugo T, Hakamada K, Narumi S, Sasaki M. Decreased postprandial gallbladder emptying in patients with black pigment stones. World J Gastroenterol 2008; 14(18): 2825-2831
- URL: https://www.wjgnet.com/1007-9327/full/v14/i18/2825.htm
- DOI: https://dx.doi.org/10.3748/wjg.14.2825


