Copyright
©2008 The WJG Press and Baishideng.
World J Gastroenterol. May 7, 2008; 14(17): 2740-2747
Published online May 7, 2008. doi: 10.3748/wjg.14.2740
Published online May 7, 2008. doi: 10.3748/wjg.14.2740
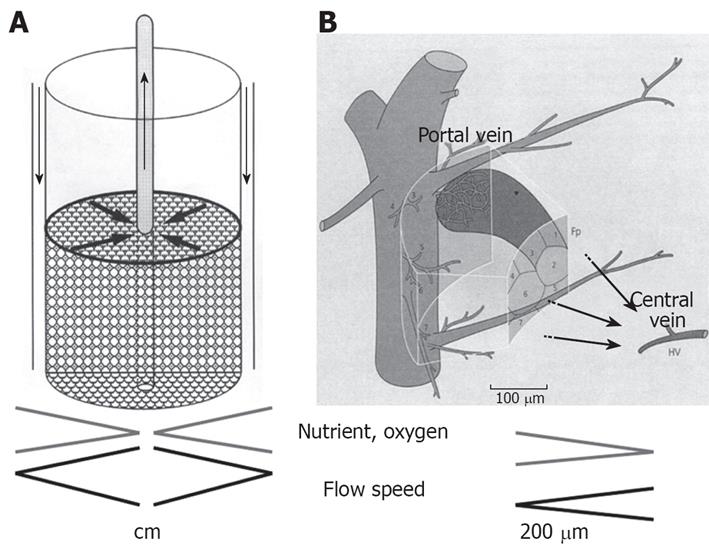
Figure 1 The principle of RFB system.
A: A cylindrical bioreactor is filled with porous cellulose beads that act as microcarriers and culture medium flows from the periphery toward the center of the reactor. Biases in distribution of oxygen and nutrients between the culture medium at the inlet and outlet of the reactor are minimized; B: The RFB system is similar to the organization of the hepatic primary lobe Figure 1B is reproduced from reference 7.
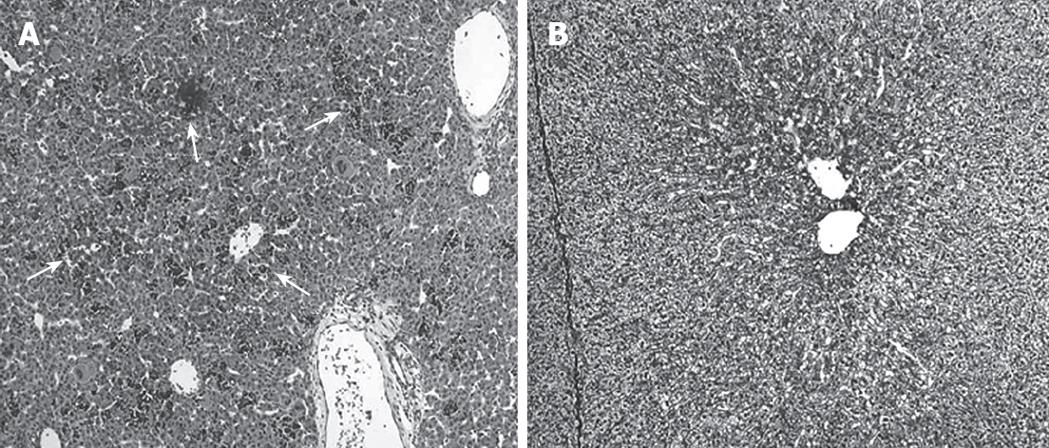
Figure 2 Histological findings of fetal porcine liver (HE staining).
A: Extramedullary hematopoiesis was observed (arrow) and the cells are largely immature at embryonic d 35 (× 100); B: A definite lobular structures and a decrease of extramedullary hematopoiesis were observed at embryonic d 56 (× 100).
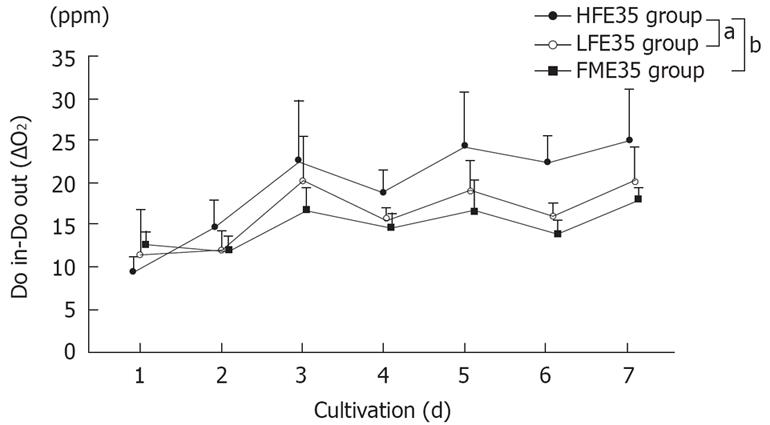
Figure 3 Changes of the oxygen consumption in the HFE35, LFE35, and FME35 groups.
HFE35 group vs FME35 group (P < 0.01), HFE35 group vs LFE35 group (P < 0.05), LFE35 group vs FME35 group (no significant). The data show the mean values, while error bars represent corresponding standard deviations. aP < 0.05, bP < 0.01.
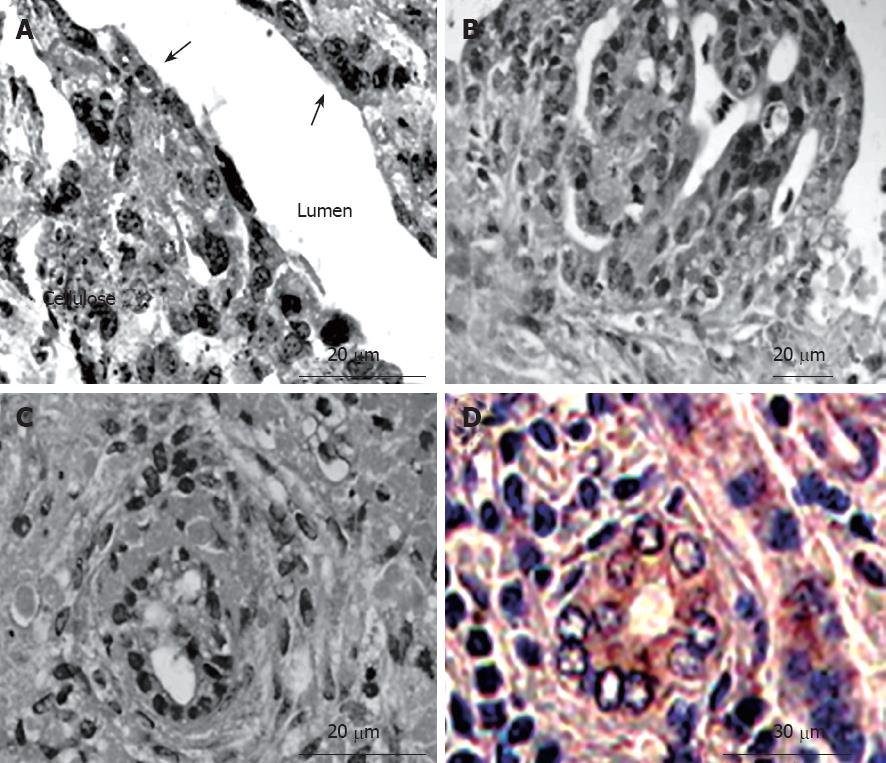
Figure 4 Histological findings of cultured cells in the RFB (hematoxylin-eosin staining and immunohistochemistry).
A: Cultured cells formed layers on the cellulose beads. Non-parenchymal cells had a flat shape and exited on the surface of the perfused side (arrow); B: A palisading structure was observed in cell clumps; C: Bile duct-like structures were also observed in cell clumps; D: The expression of cytokeratin 19 (CK19) was observed in bile duct-like structures.
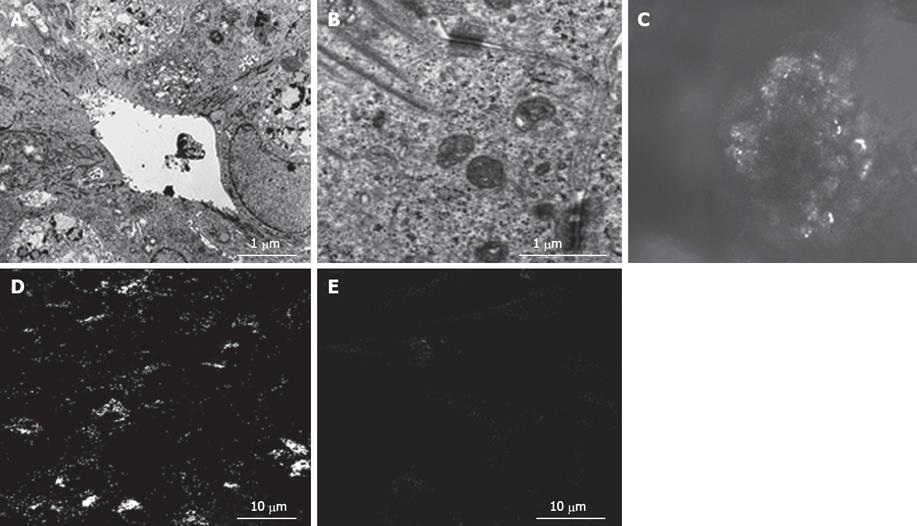
Figure 5 A: Transmission electron microscopic images revealed microvilli inside bile duct-like structures; B: Junctional complexes were well developed and tight junctions were also observed; C: Connexin 32 (Cx32) in liver organoid, showed expression in a whirl-shaped pattern; D: Cx32 in parenchymal cells in monolayer culture was fewer than that of the organoid; E: Cx32 in npon-parenchymal cells in monolayer culture was not observed.
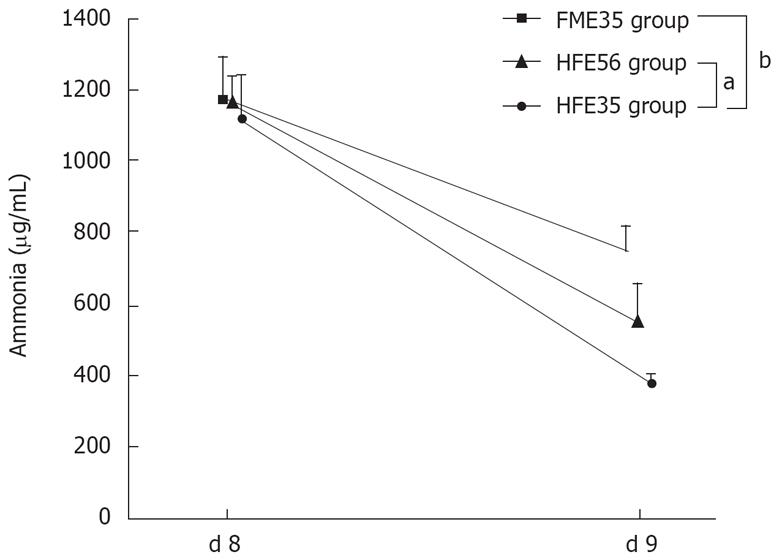
Figure 6 The NH3 loading test compared the HFE35 group, FME35 group, and HME56 group.
HFE35 group vs FME35 group (P < 0.01), HFE35 group vs HFE56 group (P < 0.05). FME35 vs HFH56 (no significant). aP < 0.05, bP < 0.01.
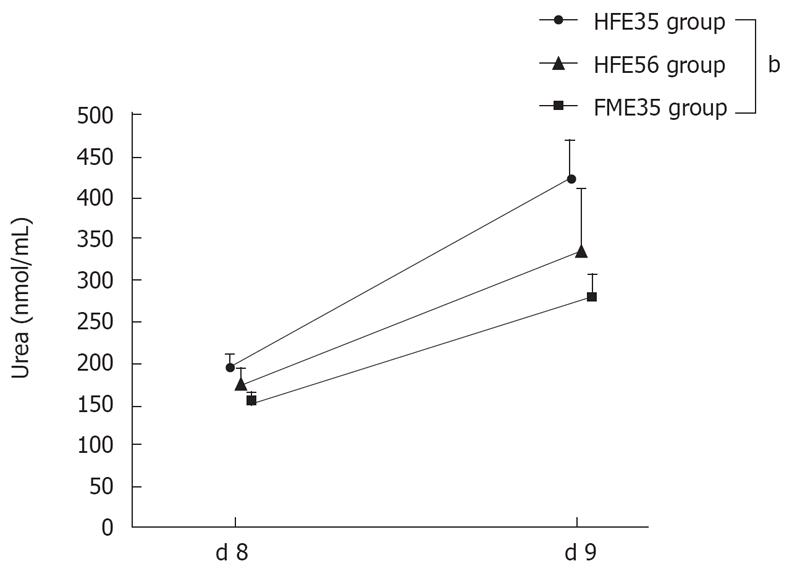
Figure 7 Changes of urea concentration in the HFE35, HFE56, and FME35 groups.
HFE35 group vs FME35 group (P < 0.01), HFE35 vs HFE56 and HFE56 vs FME35 (no significant). bP < 0.01.
- Citation: Ishii Y, Saito R, Marushima H, Ito R, Sakamoto T, Yanaga K. Hepatic reconstruction from fetal porcine liver cells using a radial flow bioreactor. World J Gastroenterol 2008; 14(17): 2740-2747
- URL: https://www.wjgnet.com/1007-9327/full/v14/i17/2740.htm
- DOI: https://dx.doi.org/10.3748/wjg.14.2740


