Copyright
©2008 The WJG Press and Baishideng.
World J Gastroenterol. May 7, 2008; 14(17): 2715-2722
Published online May 7, 2008. doi: 10.3748/wjg.14.2715
Published online May 7, 2008. doi: 10.3748/wjg.14.2715
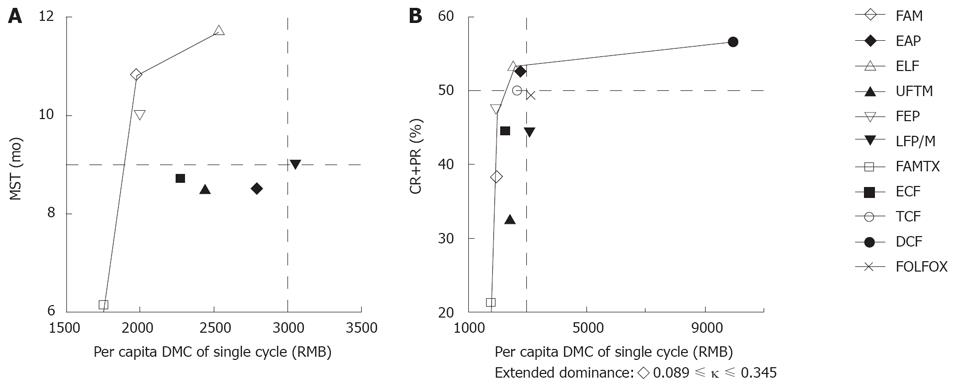
Figure 1 Plots of cost-effectiveness analyses for DMC/MST data (the MST data of TCF, DCF and FOLFOX regimens were not reported) (A), and DMC/CR+PR (B).
The regimens under the line are dominated in incremental cost-effectiveness analyses.
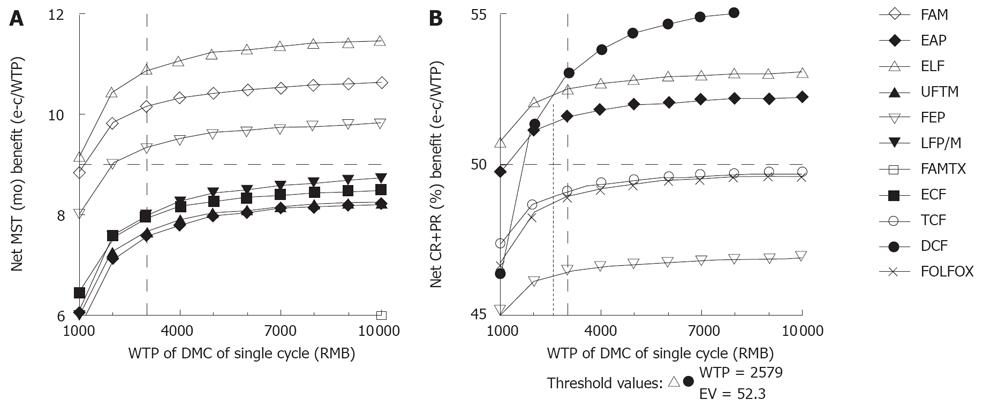
Figure 2 Sensitivity analyses by altering the willingness-to-pay from 1000 RMB to 10 000 RMB for DMC, DMC/MST data (the MST data of TCF, DCF and FOLFOX regimens were not reported) (A), and DMC/CR+PR (the curves for FAM, UFTM, LFP/M, FAMTX and ECF regimens are below the bottom of the chart) (B).
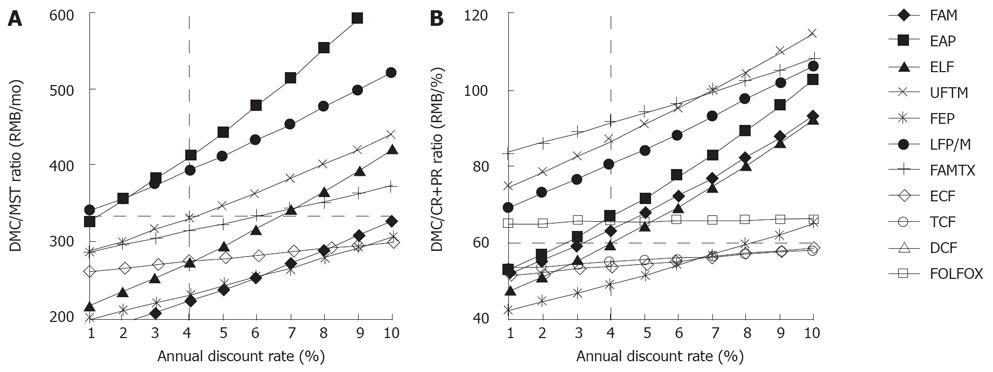
Figure 3 Sensitivity analysis by altering the annual discount rate from 1% to 10% for DMC, DMC/MST data (the MST data of TCF, DCF and FOLFOX regimens were not reported) (A), and DMC/CR+PR (the curve for DCF regimen is beyond the top of the chart) (B).
- Citation: Chen XZ, Jiang K, Hu JK, Zhang B, Gou HF, Yang K, Chen ZX, Chen JP. Cost-effectiveness analysis of chemotherapy for advanced gastric cancer in China. World J Gastroenterol 2008; 14(17): 2715-2722
- URL: https://www.wjgnet.com/1007-9327/full/v14/i17/2715.htm
- DOI: https://dx.doi.org/10.3748/wjg.14.2715


