Copyright
©2008 The WJG Press and Baishideng.
World J Gastroenterol. Apr 21, 2008; 14(15): 2406-2410
Published online Apr 21, 2008. doi: 10.3748/wjg.14.2406
Published online Apr 21, 2008. doi: 10.3748/wjg.14.2406
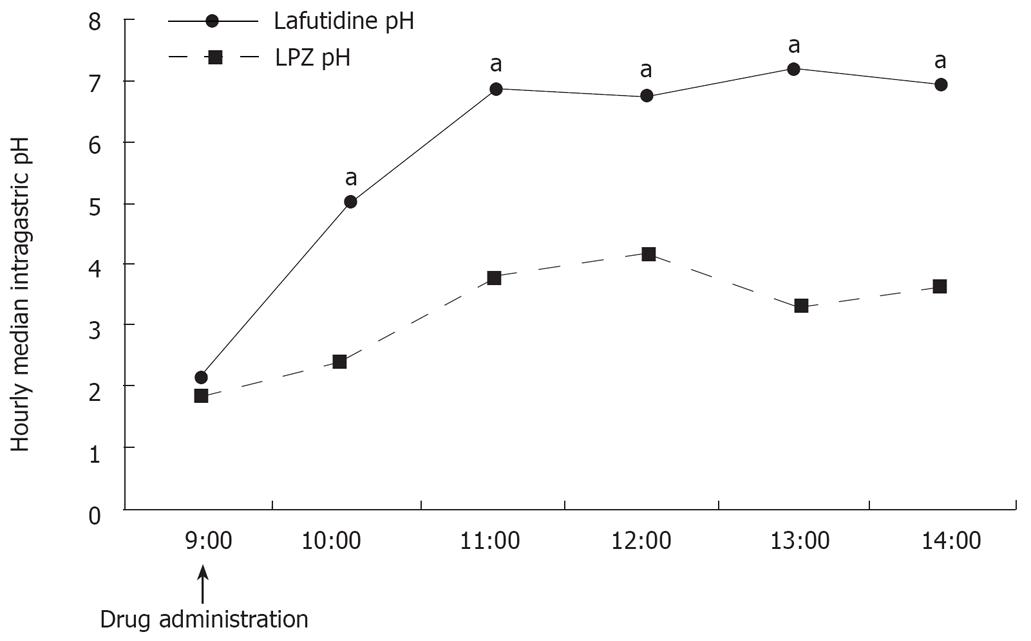
Figure 1 Median intragastric pH during a 6 h post administration period for all subjects (n = 10).
The solid line (•) shows the hourly median intragastric pH after administration of 10 mg lafutidine, and the broken line (▪) that after administration of 30 mg LPZ. The median intragastric pH values during the post administration period were significantly higher with lafutidine than with LPZ 2, 3, 4, 5, and 6 h after drug administration. Arrow: drug administration. The statistical significance of differences between the drug groups in intragastric pH among was assessed with the Wilcoxon signed-rank test. aP < 0.05 vs LPZ pH.
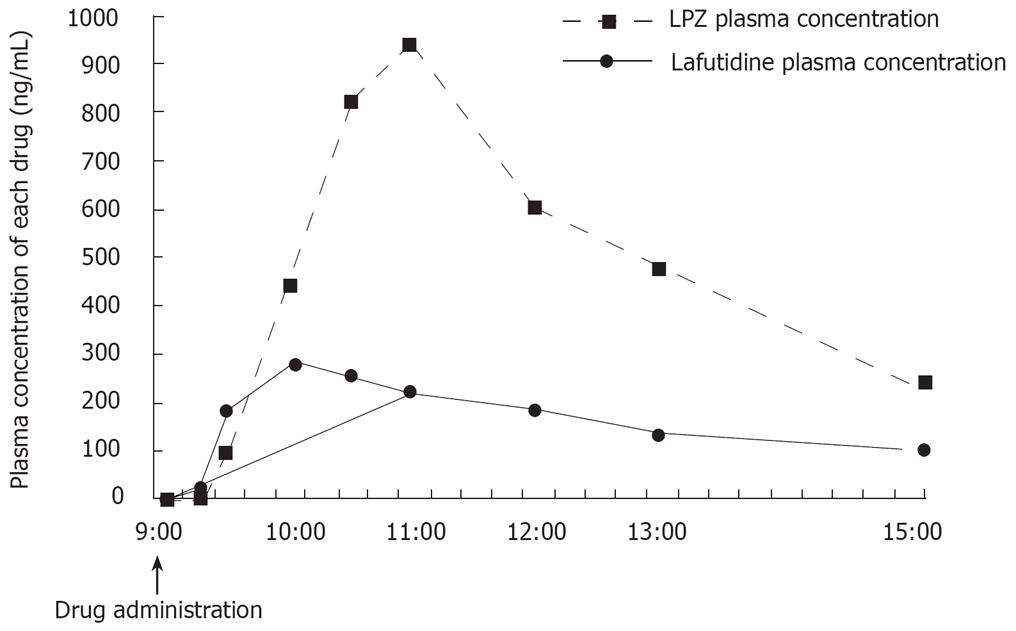
Figure 2 Plasma drug concentrations during a 6 h post administration period in four individuals (No.
1, 4, 5, 6). The solid line (•) indicates the plasma drug concentration after the administration of 10 mg lafutidine, and the broken line (▪) that after the administration of 30 mg LPZ. Lafutidine (Tmax 1 h) reached its peak plasma concentration faster than LPZ (Tmax 2 h). Arrow: Drug administration.
- Citation: Yamagishi H, Koike T, Ohara S, Horii T, Kikuchi R, Kobayashi S, Abe Y, Iijima K, Imatani A, Suzuki K, Hishinuma T, Goto J, Shimosegawa T. Stronger inhibition of gastric acid secretion by lafutidine, a novel H2 receptor antagonist, than by the proton pump inhibitor lansoprazole. World J Gastroenterol 2008; 14(15): 2406-2410
- URL: https://www.wjgnet.com/1007-9327/full/v14/i15/2406.htm
- DOI: https://dx.doi.org/10.3748/wjg.14.2406


