Copyright
©2008 The WJG Press and Baishideng.
World J Gastroenterol. Apr 21, 2008; 14(15): 2314-2322
Published online Apr 21, 2008. doi: 10.3748/wjg.14.2314
Published online Apr 21, 2008. doi: 10.3748/wjg.14.2314
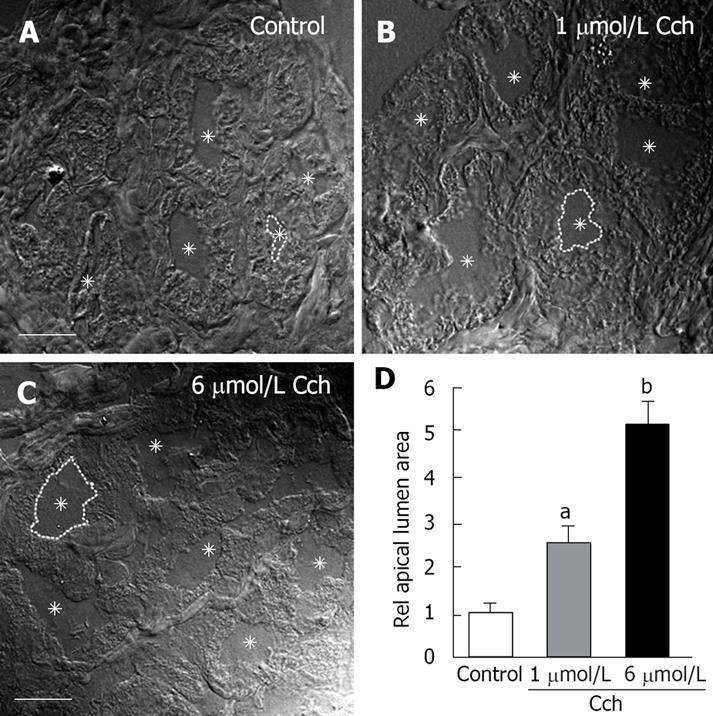
Figure 1 Carbachol-evoked dilatation of Brunner’s gland acinar lumens.
A-C: Representative differential interference contrast (DIC) images of control (A), 1 &mgr;mol/L Carbachol (B), and 6 &mgr;mol/L Carbachol (C) showing a dose-dependent dilation of the acinar lumen. In each panel, the lumens are indicated by asterisks and one of the lumens is highlighted with a broken line. D: Statistical analysis of apical lumen area relative to control. For each condition 50 glands from 3 different sets of animals were measured (n = 150). Only those glands where the complete acinus was contained in the section were studied. Scale bar = 10 &mgr;m. aP < 0.05, bP < 0.01.
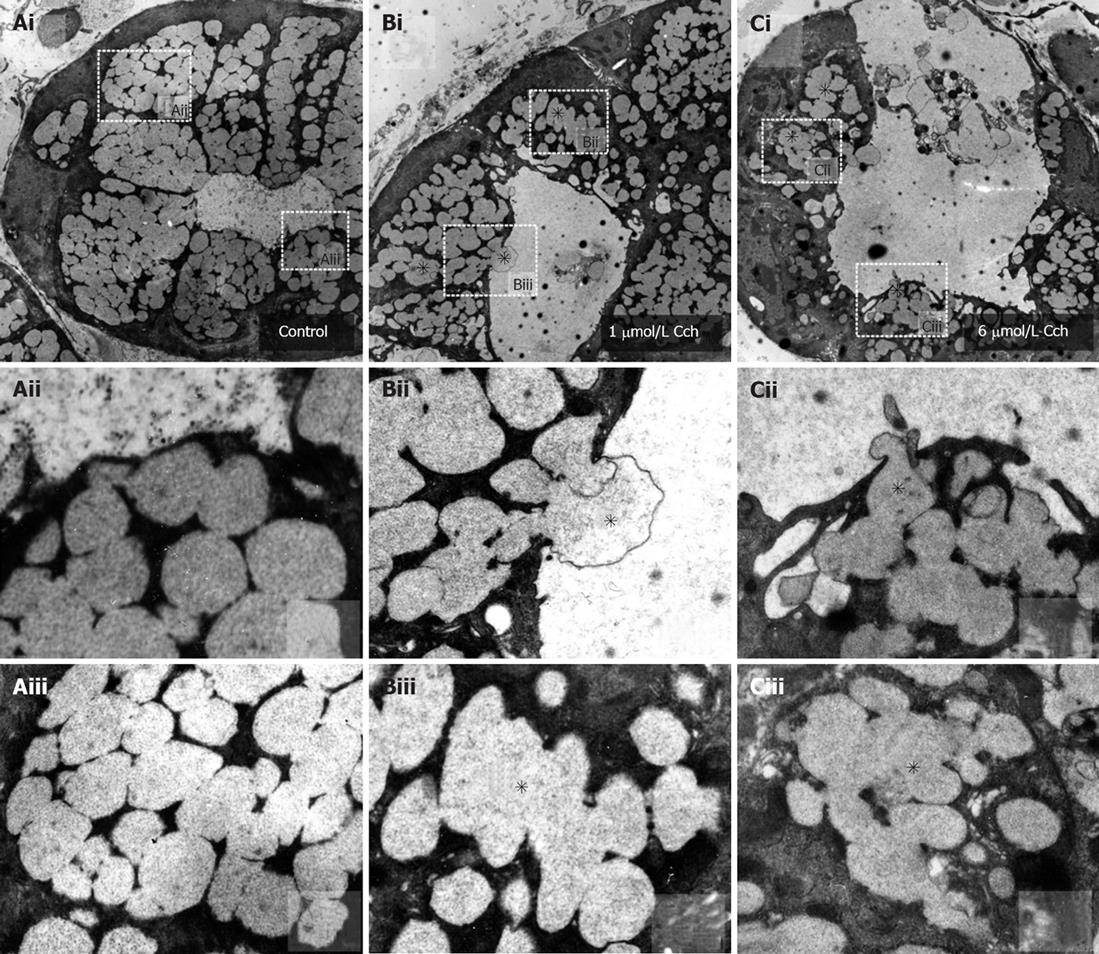
Figure 2 Carbachol-evoked mucin granule exocytosis into Brunner’s gland acinar lumens.
Representative transmission electron micrographs of Brunner’s glands in unstimulated control (A), 1 &mgr;mol/L (B) and 6 &mgr;mol/L carbachol (C) stimulated tissue. A: Unstimulated Brunner’s acinus (× 6250). Aii and Aiii are blowups of indicated regions in Ai, showing small separate vesicles; B: One &mgr;mol/L carbachol-stimulated Brunner’s acinus showing a larger apical lumen with reduced number of electron-lucent mucin vesicles within the apical poles, with some vesicles undergoing vesicle-vesicle fusions (indicated by asterisk, × 6250). Bii and Biii are blowups of indicated regions in Bi, showing compound exocytosis and vesicle-vesicle fusion (indicated by asterisks), respectively; C: Six &mgr;mol/L carbachol stimulated Brunner’s acinus. There is much less remaining vesicles some of which are undergoing vesicle-vesicle fusion (indicated by asterisk, × 5000). Cii and Ciii are blowups of indicated regions in Ci, showing compound exocytosis and vesicle-vesicle fusion (indicated by asterisks), respectively.
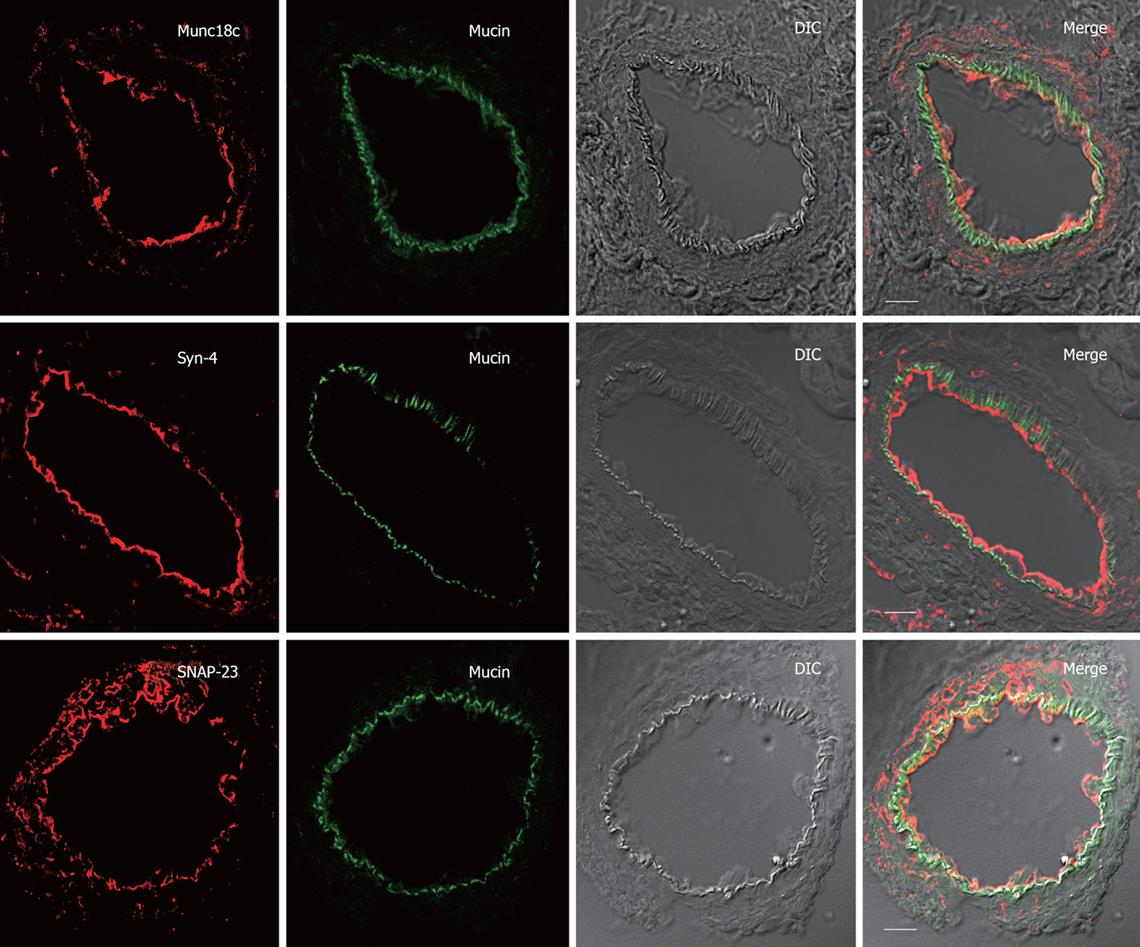
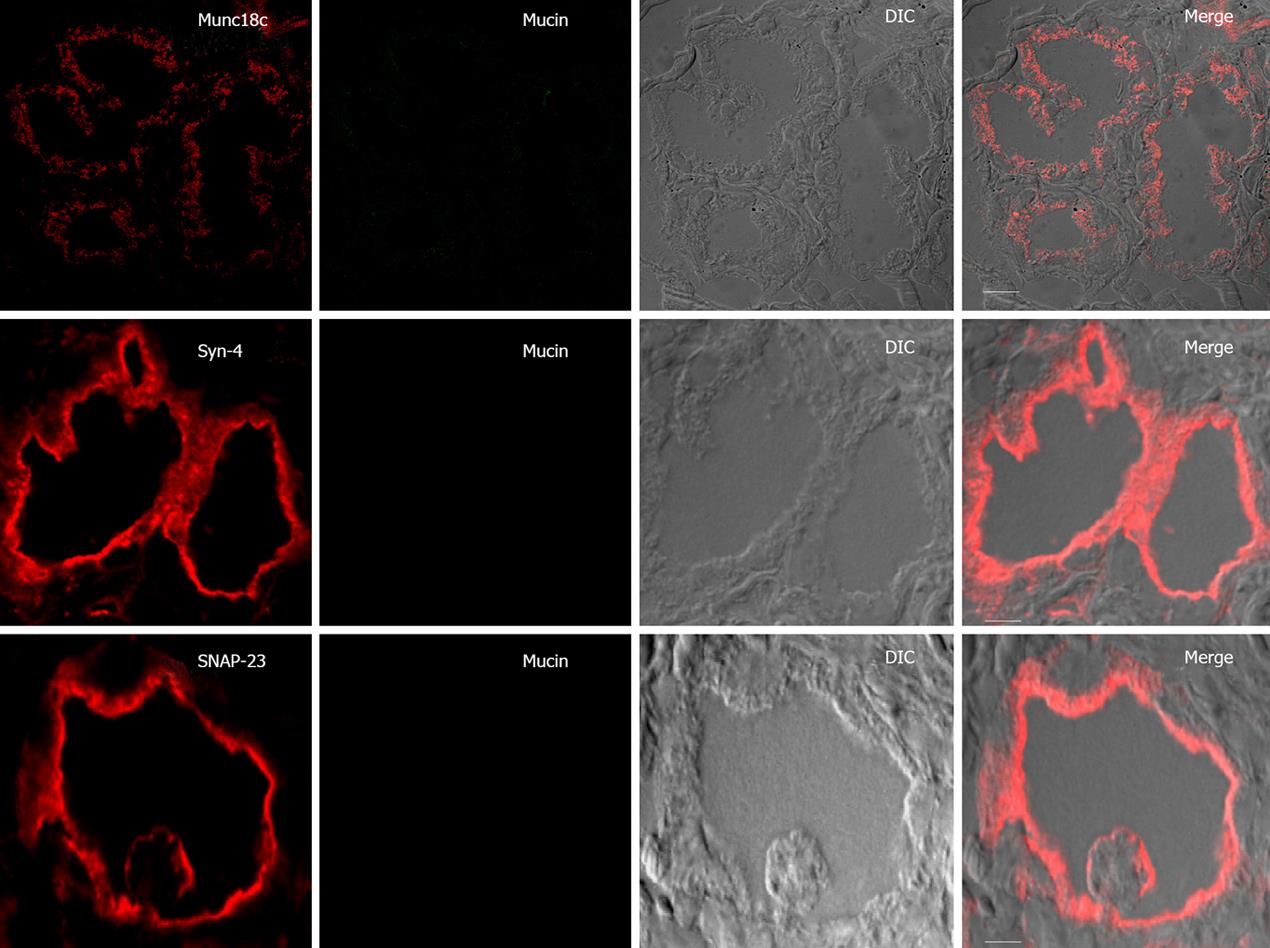
Figure 3 Apical SNARE localization in unstimulated Brunner’s gland acini.
Confocal images of unstimulated Brunner’s gland acini labeled with anti-mucin antibody (in green) and double labeled with anti-Munc18c, Syntaxin-4 or SNAP-23 antibodies (in red), and an overlay (merge) of the two with the DIC, which is also separately shown. Note the apical plasma membrane staining of Munc18c (and SNAP-23 and Syntaxin-4) and mucin accumulation beneath it. Scale bars correspond to 10 &mgr;m.
Figure 4 SNARE localization after low carbachol (1 &mgr;mol/L) stimulation of Brunner’s gland acini.
Confocal images of 1 &mgr;mol/L carbachol-stimulated Brunner’s gland acini labeled with anti-mucin antibody (in green) and double labeled with anti-Munc18c, Syntaxin-4 or SNAP-23 antibodies (in red), and an overlay (merge) of the two with the DIC, which is also separately shown. Note the loss of apical plasma membrane staining of Munc18c with some staining in the cytosol, and much reduced mucin staining. Scale bars correspond to 10 &mgr;m.
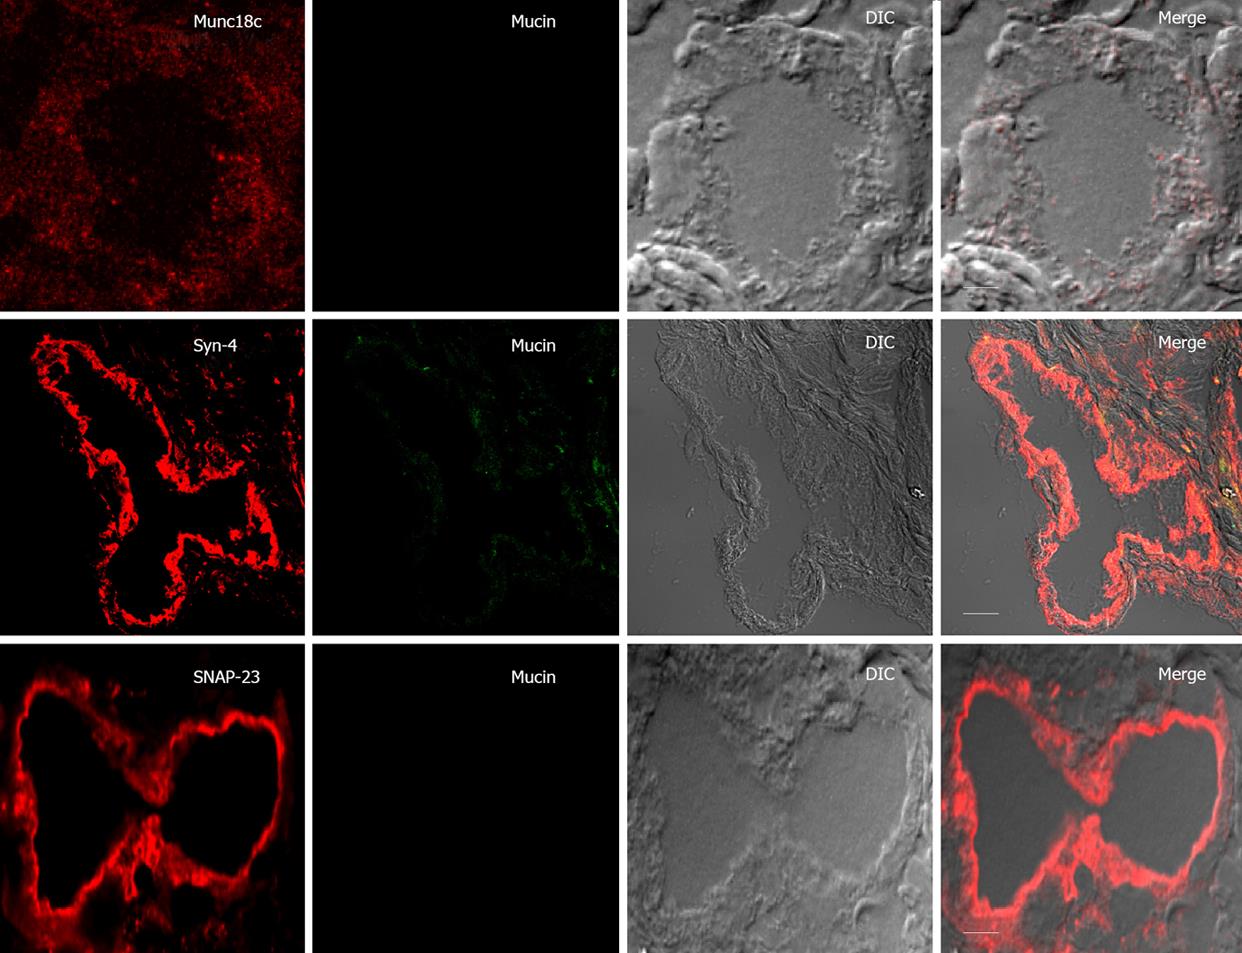
Figure 5 SNARE localization after high carbachol (6 &mgr;mol/L) stimulation of Brunner’s gland acini.
Confocal images of 6 &mgr;mol/L carbachol-stimulated Brunner’s gland acini labeled with anti-mucin antibody (in green) and double labeled with anti-Munc18c, Syntaxin-4 or SNAP-23 antibodies (in red), and an overlay (Merge) of the two with the DIC, which is also separately shown. Note the further reduced apical plasma membrane staining of Munc18c (vs Figure 4) and the absence of mucin staining in the cells. DIC images exhibit dilated lumens. Scale bars correspond to 10 &mgr;m.
- Citation: Cosen-Binker LI, Morris GP, Vanner S, Gaisano HY. Munc18/SNARE proteins’ regulation of exocytosis in guinea pig duodenal Brunner’s gland acini. World J Gastroenterol 2008; 14(15): 2314-2322
- URL: https://www.wjgnet.com/1007-9327/full/v14/i15/2314.htm
- DOI: https://dx.doi.org/10.3748/wjg.14.2314


