Copyright
©2008 The WJG Press and Baishideng.
World J Gastroenterol. Apr 14, 2008; 14(14): 2168-2173
Published online Apr 14, 2008. doi: 10.3748/wjg.14.2168
Published online Apr 14, 2008. doi: 10.3748/wjg.14.2168
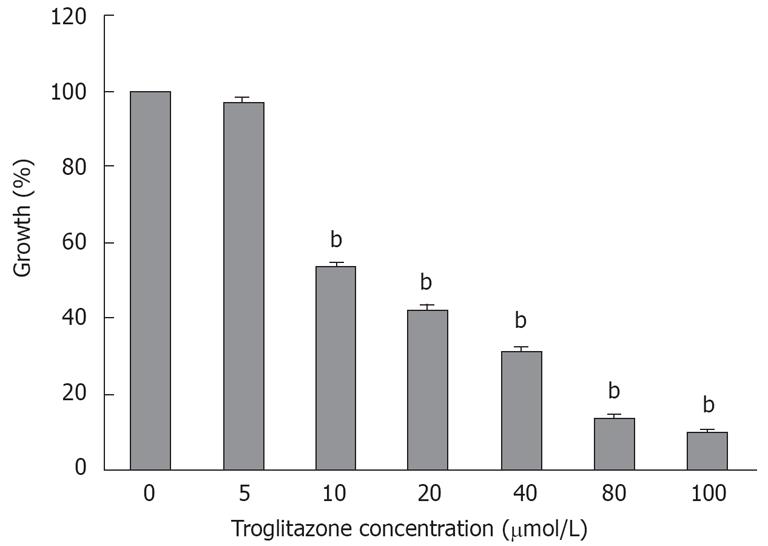
Figure 1 Effect of troglitazone on growth of HepG2 cells.
Cells were incubated with different concentrations of troglitazone for 120 h. Troglitazone inhibited growth of HepG2 cells in a dose-dependent manner, as demonstrated by MTT assay. Data represent the mean ± SD from six wells. bP < 0.01 vs corresponding control group (unpaired Student’s t test).
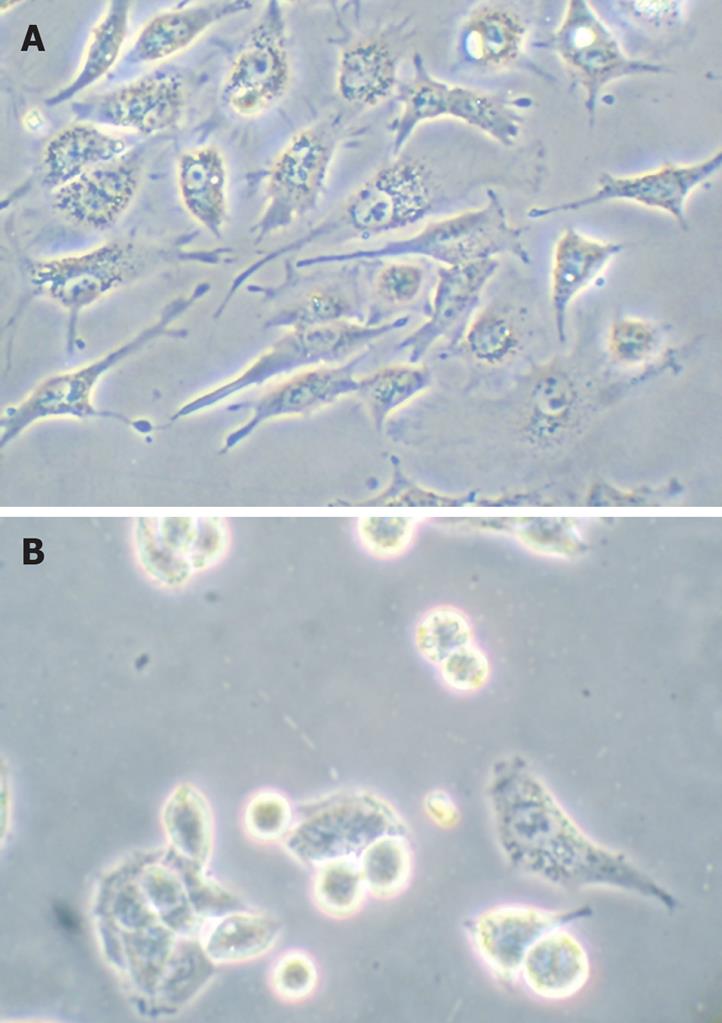
Figure 2 Morphological changes were examined by phase-contrast microscopy.
A:Controls; B: 30 &mgr;mol/L troglitazone.
Figure 3 Cell cycle analysis by flow cytometry.
A: Control cells; B: 20 &mgr;mol/L troglitazone; C: 30 &mgr;mol/L troglitazone.
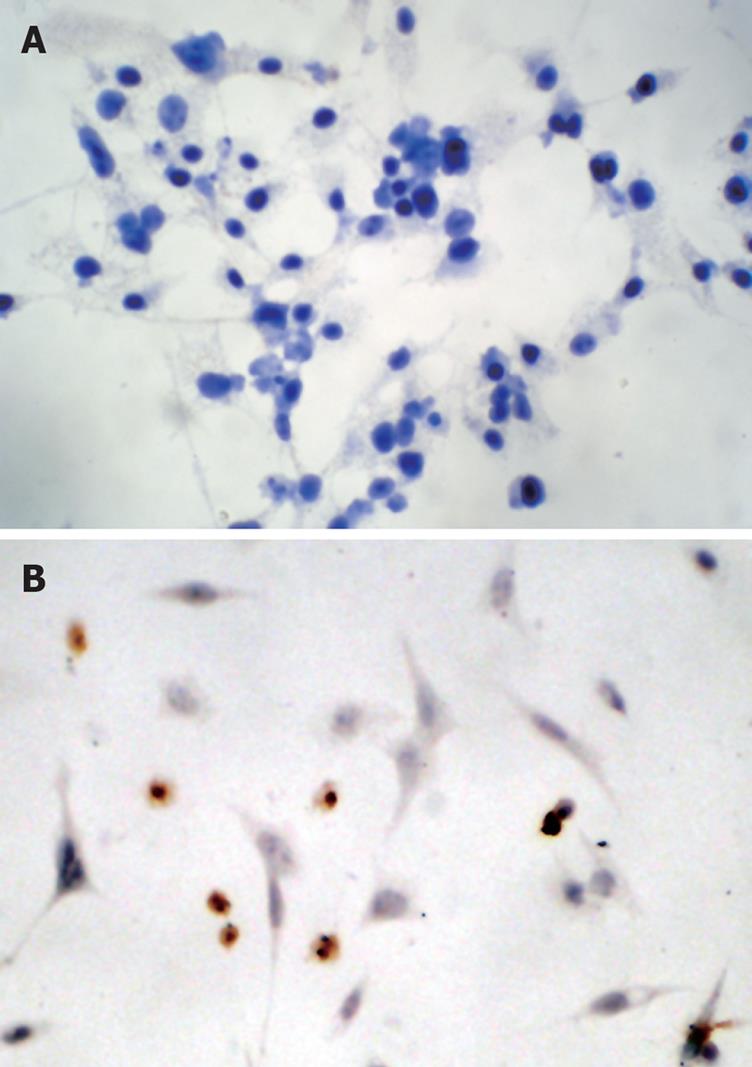
Figure 4 Troglitazone significantly increased the number of TUNEL-positive cells in a dose-dependent manner.
A: Control cells; B: 20 &mgr;mol/L troglitazone; C: 30 &mgr;mol/L troglitazone.
Figure 5 Immunocytochemistry showed that caspase-3 was activated.
The shrunken cells were positively stained for activated caspase-3. No positive cell was detectable in the control group ( A: original magnification, × 200). Whereas large numbers of positive cells labeled for activated caspase-3 were observed in HepG2 cells treated with 30 &mgr;mol/L troglitazone for 24 h ( B: original magnification, × 400).
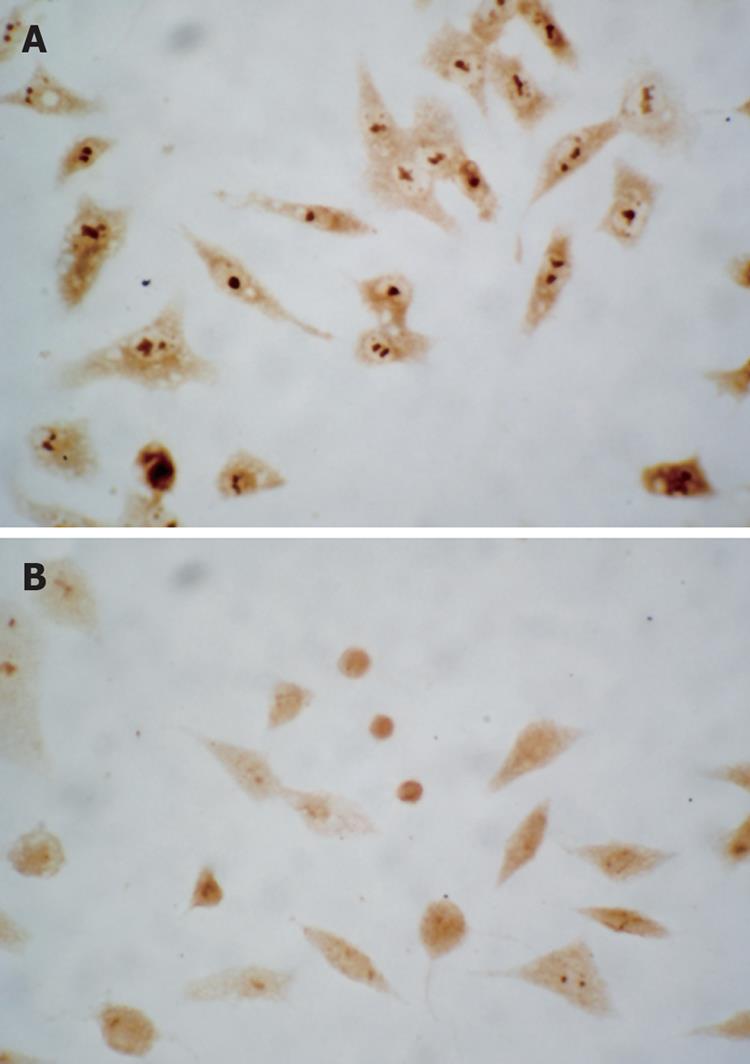
Figure 6 Survivin was present predominantly in the nucleus in untreated cells ( A: original magnification, × 400) as demonstrated by immunocytochemistry.
After exposure of HepG2 cells to 30 &mgr;mol/L troglitazone for 24 h, survivin incompletely translocated from the nucleus to the cytoplasma ( B: original magnification, × 400).
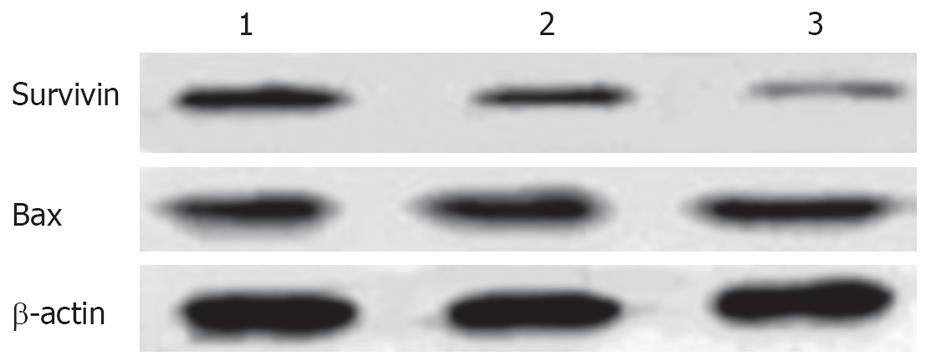
Figure 7 Effect of troglitazone on the expression of Bax and survivin.
Lane 1: Control cells; lane 2: 20 &mgr;mol/L troglitazone; lane 3: 30 &mgr;mol/L troglitazone.
- Citation: Zhou YM, Wen YH, Kang XY, Qian HH, Yang JM, Yin ZF. Troglitazone, a peroxisome proliferator-activated receptor γ ligand, induces growth inhibition and apoptosis of HepG2 human liver cancer cells. World J Gastroenterol 2008; 14(14): 2168-2173
- URL: https://www.wjgnet.com/1007-9327/full/v14/i14/2168.htm
- DOI: https://dx.doi.org/10.3748/wjg.14.2168


