Copyright
©2008 The WJG Press and Baishideng.
World J Gastroenterol. Apr 7, 2008; 14(13): 2044-2048
Published online Apr 7, 2008. doi: 10.3748/wjg.14.2044
Published online Apr 7, 2008. doi: 10.3748/wjg.14.2044
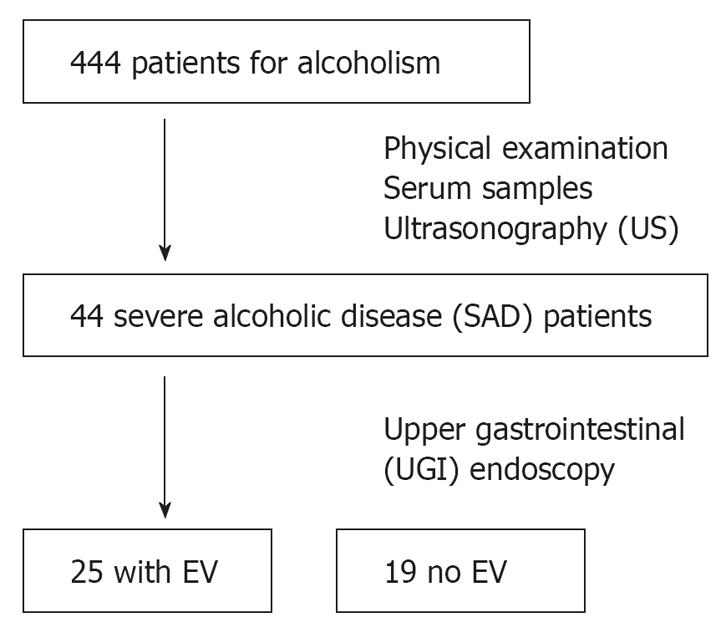
Figure 1 Flow chart of patients in this study.
EV: Esophageal varice.
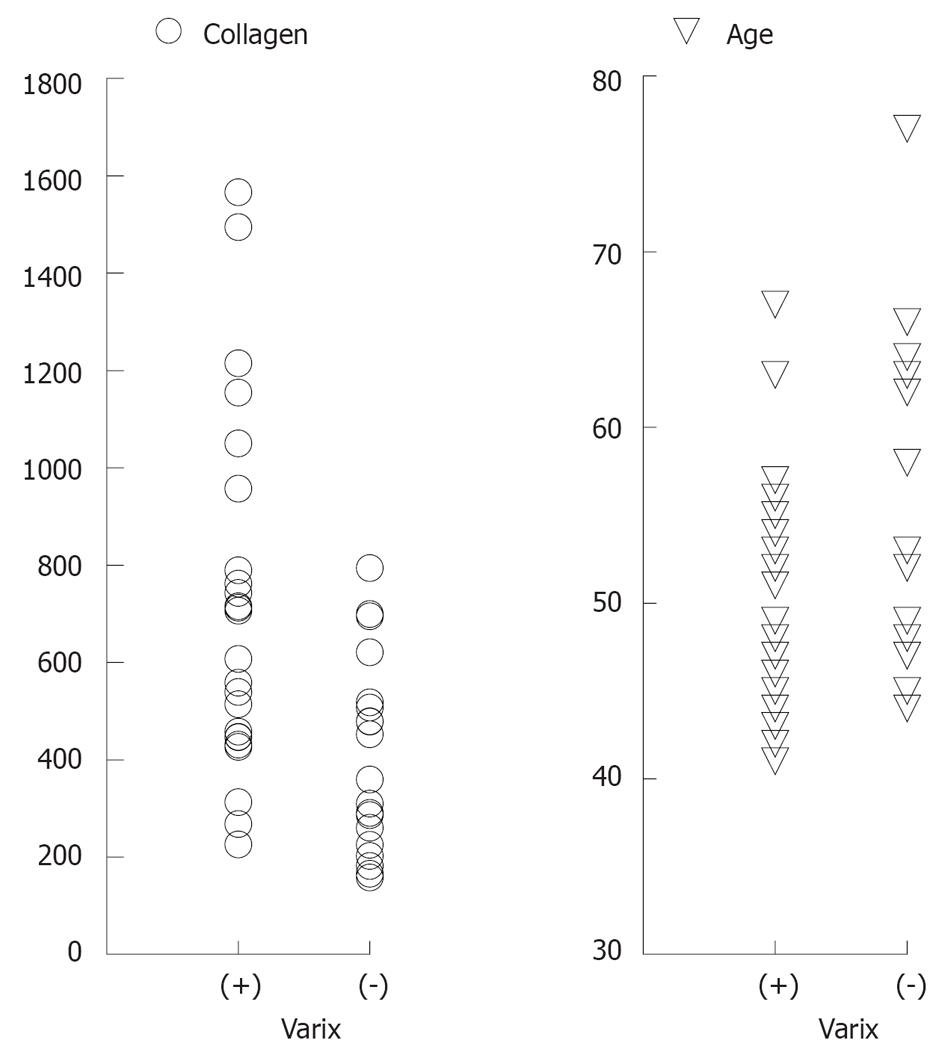
Figure 2 Two independent factors correlated with the appearance of esophageal varices.
Collagen: Collagen type IV (ng/mL); (+): Positive patients; (-): Negative patients.
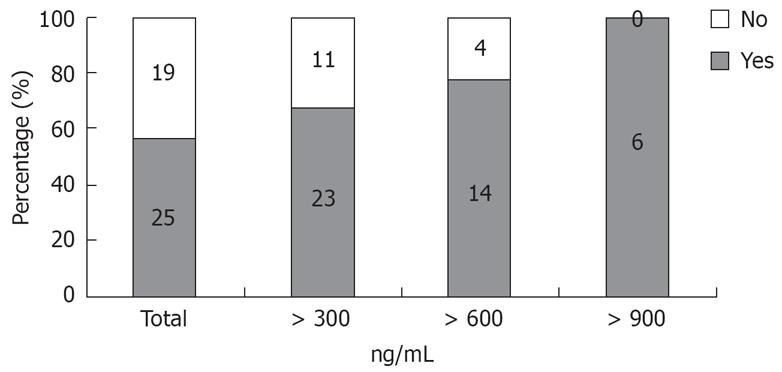
Figure 3 The positive predictive value for esophageal varices of collagen type IV.
Y-axis: Positive percentages of esophageal varices; X-axis: The total predictive value of esophageal varices; > 300 (600, 900): The positive predictive value of esophageal varices with a collagen type IV value > 300 (600, 900) ng/mL.
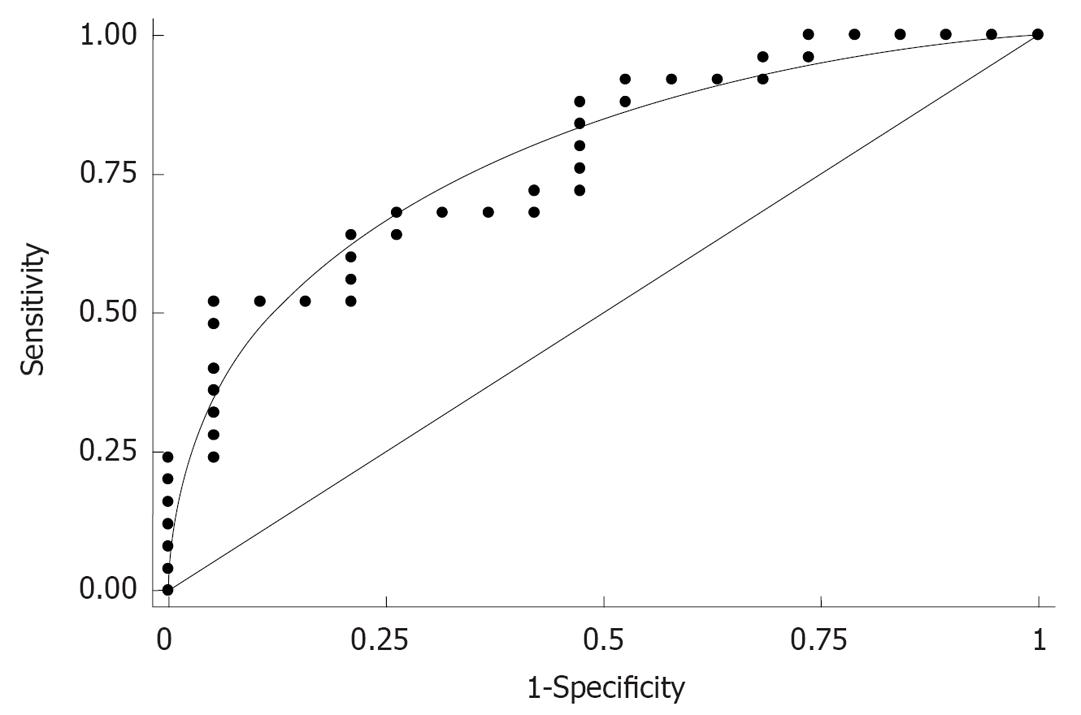
Figure 4 Receiver operating characteristics (ROC) curve of collagen type IV for the diagnosis of esophageal varices [area under curve = 0.
7802, se (area) = 0.0704].
- Citation: Mamori S, Searashi Y, Matsushima M, Hashimoto K, Uetake S, Matsudaira H, Ito S, Nakajima H, Tajiri H. Serum type IV collagen level is predictive for esophageal varices in patients with severe alcoholic disease. World J Gastroenterol 2008; 14(13): 2044-2048
- URL: https://www.wjgnet.com/1007-9327/full/v14/i13/2044.htm
- DOI: https://dx.doi.org/10.3748/wjg.14.2044


