Copyright
©2008 The WJG Press and Baishideng.
World J Gastroenterol. Apr 7, 2008; 14(13): 2023-2028
Published online Apr 7, 2008. doi: 10.3748/wjg.14.2023
Published online Apr 7, 2008. doi: 10.3748/wjg.14.2023
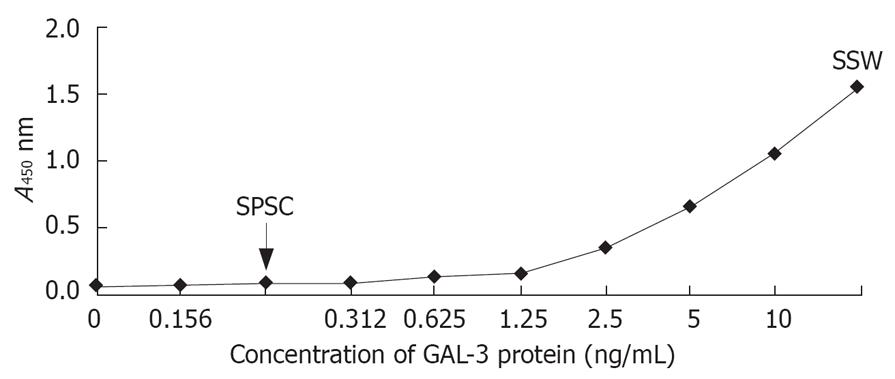
Figure 1 Concentration of GAL-3 in SPSC and SSW (ELISA).
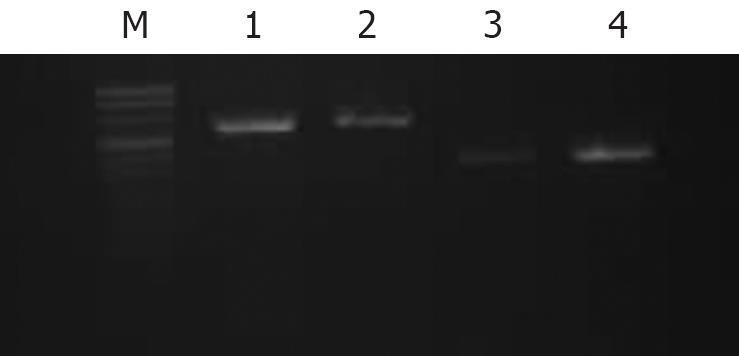
Figure 2 GAL-3 mRNA of SW1990 cells detected by RT-PCR.
M: Marker; 1: GAPDH of control group; 2: GAPDH after stimulation with 40% SPSC; 3: GAL-3 of control group; 4: GAL-3 after stimulation with 40% SPSC.
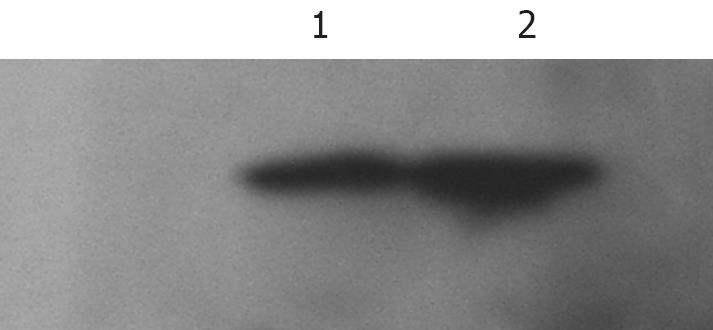
Figure 3 GAL-3 protein of SW1990 cells detected by Western blotting.
1: GAL-3 of control group; 2: GAL-3 after stimulation with 40% SPSC.
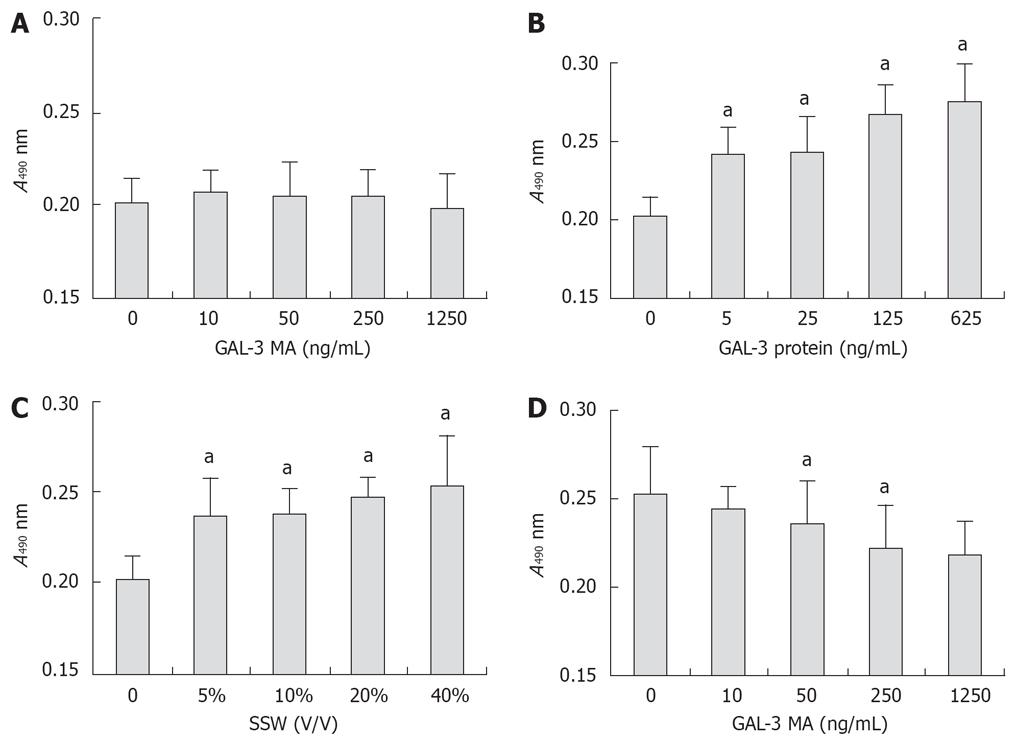
Figure 4 Proliferation of PSCs detected by MTT assay.
(A) Absorbance at 490 nm after exposure to different concentrations of GAL-3 MA; (B) Absorbance at 490 nm after exposure to different concentrations of recombinant human GAL-3 protein; (C) Absorbance at 490 nm after exposure to different concentrations of SSW; (D) Absorbance at 490 nm after exposure to 40% SSW plus different concentrations of GAL-3 MA (aP < 0.05).
Figure 5 Proliferation of SW1990 cells detected by MTT assay.
(A) Absorbance at 490 nm after exposure to different concentrations of GAL-3 MA; (B) Absorbance at 490 nm after exposure to different concentrations of SPSC; (C) Absorbance at 490 nm after exposure to 40% SPSC plus different concentrations of GAL-3 MA (aP < 0.05).
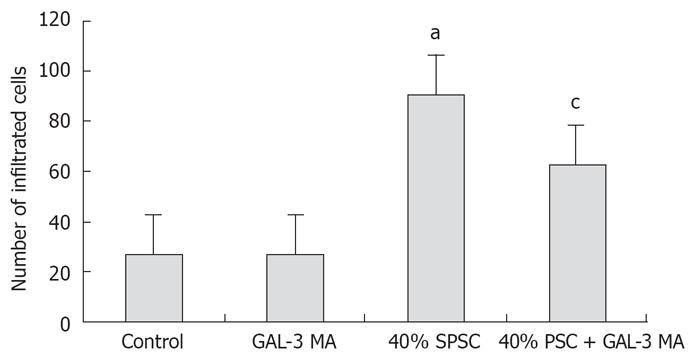
Figure 6 Number of infiltrating cells in each group.
aP < 0.05 vs control; cP < 0.05 vs 40% SPSC.
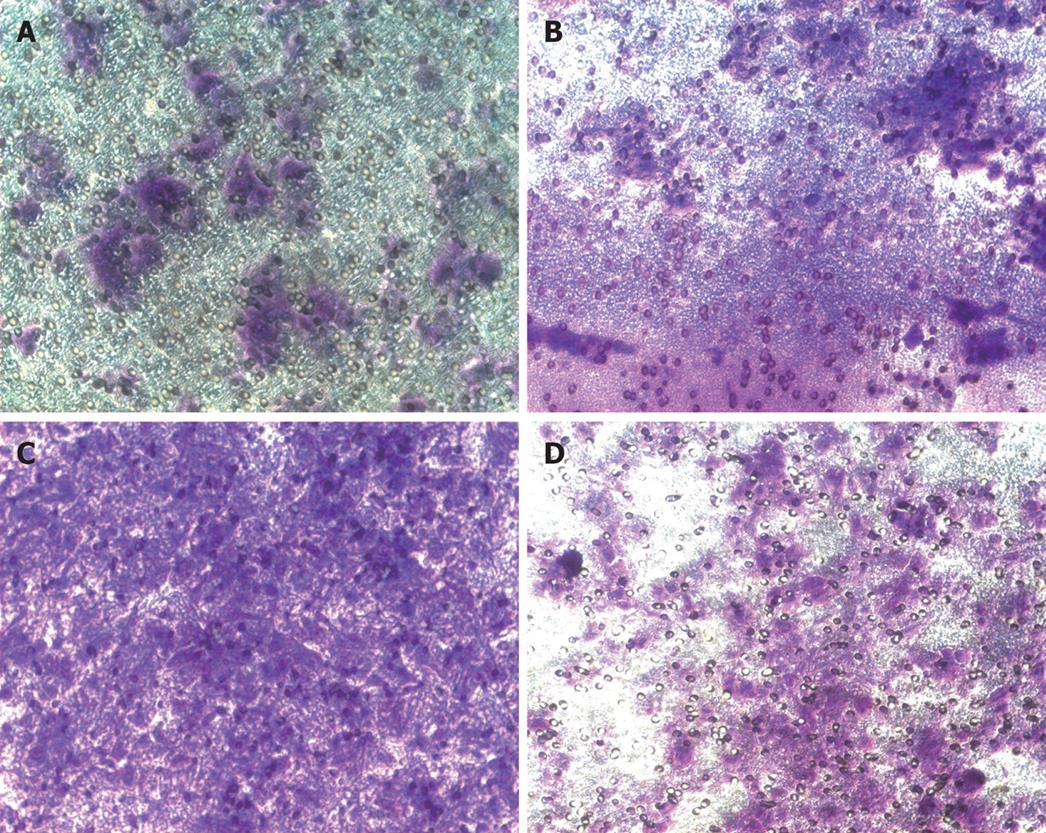
Figure 7 Infiltrating SW1990 cells.
(A) Control group. (B) GAL-3 MA group. (C) SPSC group. (D) SPSC plus GAL-3 MA group. Compared with the control group, GAL-3 antibody had no significant effect on invasion of SW1990 cells. SPSC stimulated the invasion process of SW1990 cells, and this stimulation was partly inhibited by GAL-3 antibody.
-
Citation: Jiang HB, Xu M, Wang XP. Pancreatic stellate cells promote proliferation and invasiveness of human pancreatic cancer cells
via galectin-3. World J Gastroenterol 2008; 14(13): 2023-2028 - URL: https://www.wjgnet.com/1007-9327/full/v14/i13/2023.htm
- DOI: https://dx.doi.org/10.3748/wjg.14.2023


