Copyright
©2007 Baishideng Publishing Group Co.
World J Gastroenterol. Feb 28, 2007; 13(8): 1170-1174
Published online Feb 28, 2007. doi: 10.3748/wjg.v13.i8.1170
Published online Feb 28, 2007. doi: 10.3748/wjg.v13.i8.1170
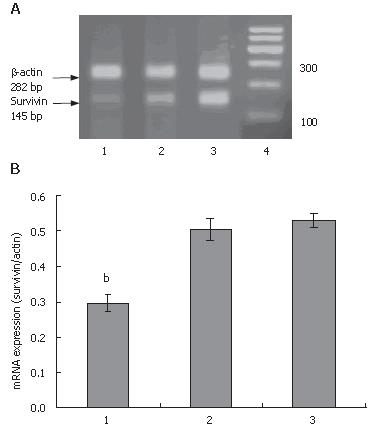
Figure 1 Expression of survivin mRNA in different groups of SGC-7901 cells.
A: Survivin mRNA expression in RT-PCR assay; B: Survivin mRNA expression in SGC-7901. 1: treated with survivin siRNA; 2: treated with non-silencing siRNA; 3: untreated. Data are expressed as mean ± SD of three experiments, survivin siRNA group vs non-silencing siRNA group, bP < 0.01 ; survivin siRNA group vs untreated group, bP < 0.01.
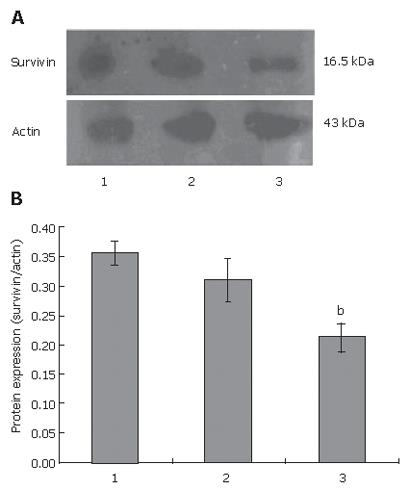
Figure 2 Western blot assay of survivin protein expression in SGC-7901 cells.
A: Survivin protein expression in Western blot assay; B: Survivin protein expression in SGC-7901.1: untreated; 2: non-silencing siRNA; 3: survivin siRNA. Data are expressed as mean ± SD of three experiments, survivin siRNA group vs non-silencing siRNA group, bP < 0.01; survivin siRNA group vs untreated group, bP < 0.01.
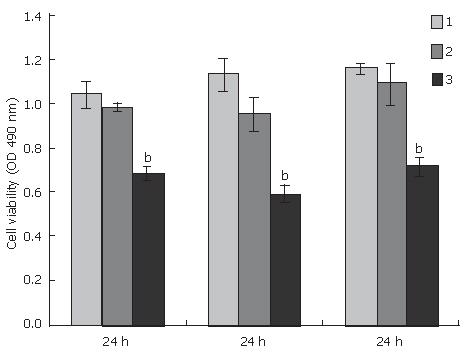
Figure 3 Effects on cell viability after non-silencing siRNA and survivin siRNA treatment.
1: untreated; 2: non-silencing siRNA; 3: survivin siRNA. Data are expressed as mean ± SD, survivin siRNA group vs non-silencing siRNA group, bP < 0.01; survivin siRNA group vs untreated group, bP < 0.01.
- Citation: Miao GY, Lu QM, Zhang XL. Downregulation of survivin by RNAi inhibits growth of human gastric carcinoma cells. World J Gastroenterol 2007; 13(8): 1170-1174
- URL: https://www.wjgnet.com/1007-9327/full/v13/i8/1170.htm
- DOI: https://dx.doi.org/10.3748/wjg.v13.i8.1170


