Copyright
©2007 Baishideng Publishing Group Co.
World J Gastroenterol. Feb 21, 2007; 13(7): 1003-1009
Published online Feb 21, 2007. doi: 10.3748/wjg.v13.i7.1003
Published online Feb 21, 2007. doi: 10.3748/wjg.v13.i7.1003
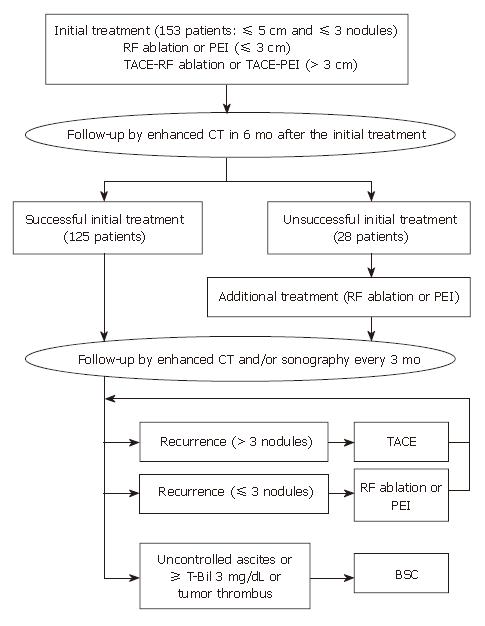
Figure 1 Follow-up chart of overall treatment design.
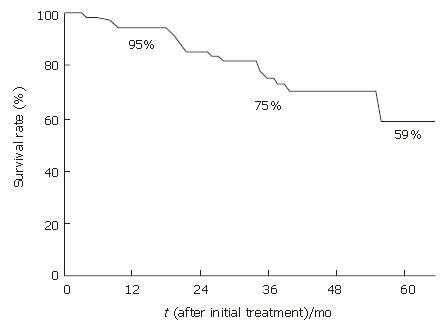
Figure 2 Overall probability of survival.
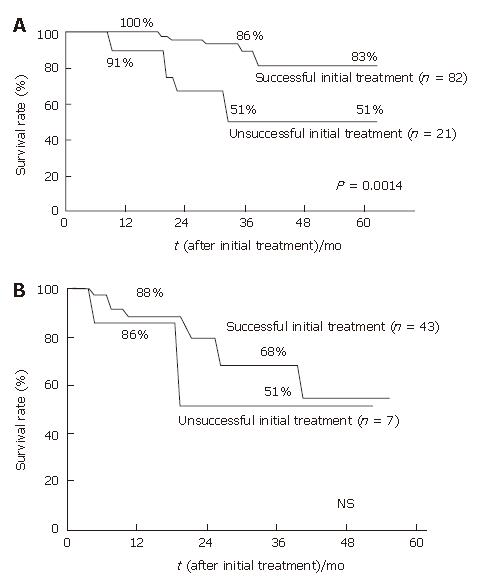
Figure 3 Overall probability of survival according to initial treatment response.
A: In patients with a serum albumin level > 3.5 g/dL; B: In patients with a serum albumin level ≤ 3.5 g/dL.
- Citation: Morimoto M, Numata K, Sugimori K, Shirato K, Kokawa A, Oka H, Hirasawa K, Koh R, Nihommatsu H, Tanaka K. Successful initial ablation therapy contributes to survival in patients with hepatocellular carcinoma. World J Gastroenterol 2007; 13(7): 1003-1009
- URL: https://www.wjgnet.com/1007-9327/full/v13/i7/1003.htm
- DOI: https://dx.doi.org/10.3748/wjg.v13.i7.1003


