Copyright
©2007 Baishideng Publishing Group Co.
World J Gastroenterol. Feb 14, 2007; 13(6): 964-969
Published online Feb 14, 2007. doi: 10.3748/wjg.v13.i6.964
Published online Feb 14, 2007. doi: 10.3748/wjg.v13.i6.964
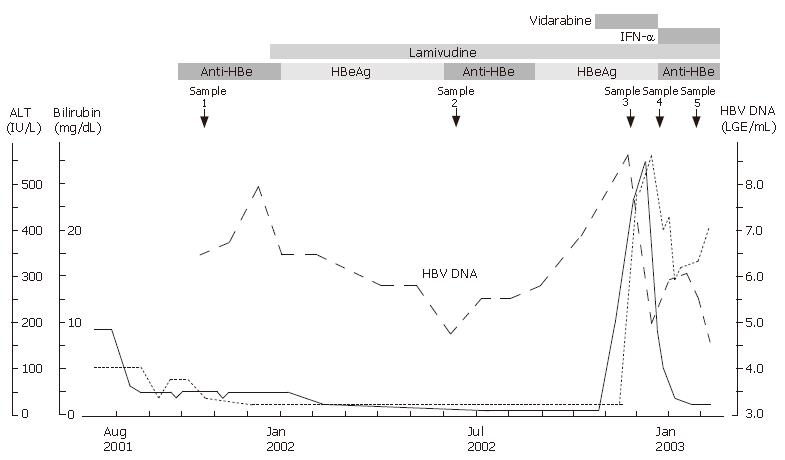
Figure 1 Clinical course of our patient.
HBV DNA level was quantified by transcription-mediated amplification assay. The levels of HBV DNA started to increase 8 mo after treatment with reappearance of HBeAg. Breakthrough hepatitis developed 12 mo after treatment. The timing of serum sample analysis for mutations is shown by the arrowhead.
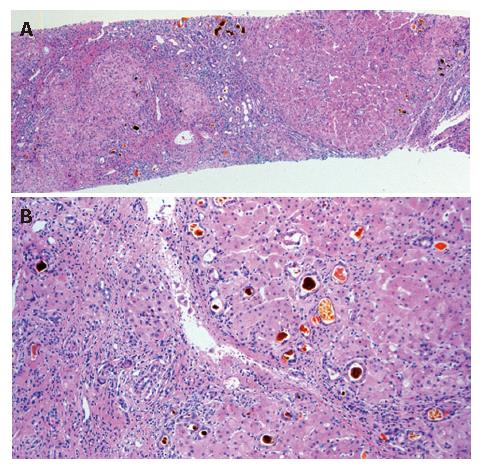
Figure 2 Histopathological findings of liver specimens showing irregularly-shaped parenchymal cells with massive necrosis (A) and scarce hepatocyte regeneration (B) surrounded by extensive fibrosis (A: HE × 20; B: HE × 80).
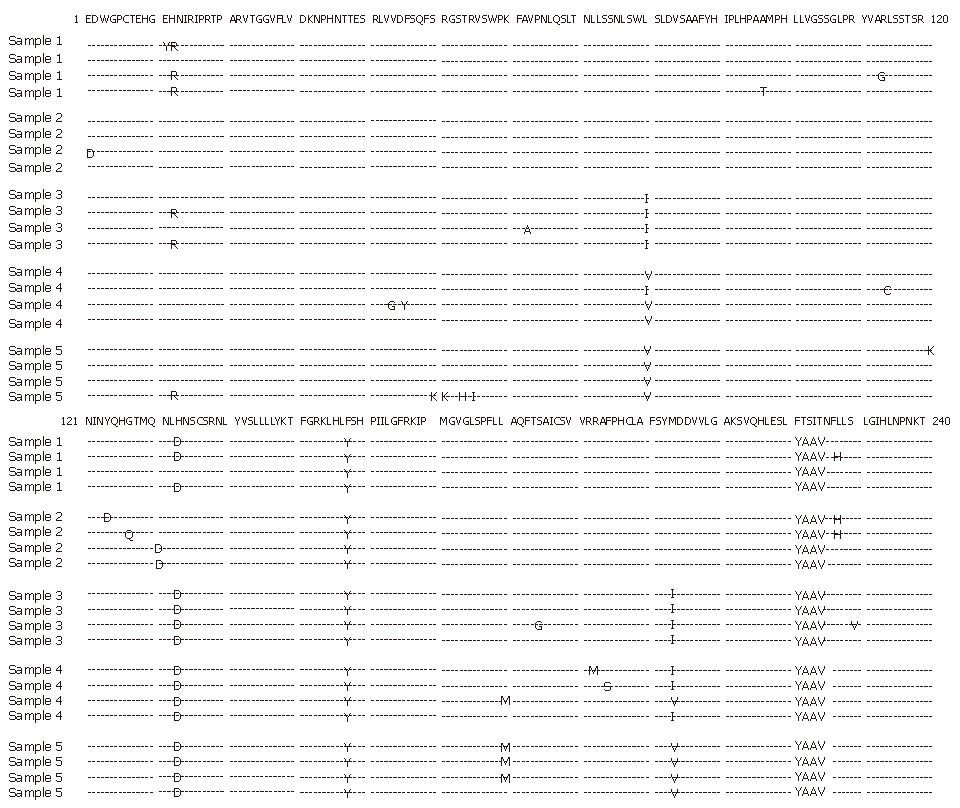
Figure 3 Comparison of amino acid sequences of HBV polymerase gene of isolates before lamivudine treatment (sample 1) and four sequential isolates (samples 2-5) during treatment.
A HBV mutant with substitutions of isoleucine for leucine at residue 80 (rtL80I) in combination with isoleucine for methionine at residue 204 (rtM204I) was observed 12 mo after treatment (sample 3). After vidarabine treatment, another HBV mutant with substitutions of valine for leucine at residue 80 (rtL80V) and valine for methionine at residue 204 (rtM204V) was observed (sample 4). These mutations predominated in combination with methionine for leucine at residue 180 (rtL180M) after interferon treatment (sample 5). The published HBV DNA sequence of hepatitis B virus variant (genotype C, AB033550, Okamoto et al) was used for comparison.
- Citation: Suzuki Y, Yotsuyanagi H, Okuse C, Nagase Y, Takahashi H, Moriya K, Suzuki M, Koike K, Iino S, Itoh F. Fatal liver failure caused by reactivation of lamivudine-resistant hepatitis B virus: A case report. World J Gastroenterol 2007; 13(6): 964-969
- URL: https://www.wjgnet.com/1007-9327/full/v13/i6/964.htm
- DOI: https://dx.doi.org/10.3748/wjg.v13.i6.964


