Copyright
©2007 Baishideng Publishing Group Co.
World J Gastroenterol. Feb 7, 2007; 13(5): 761-767
Published online Feb 7, 2007. doi: 10.3748/wjg.v13.i5.761
Published online Feb 7, 2007. doi: 10.3748/wjg.v13.i5.761
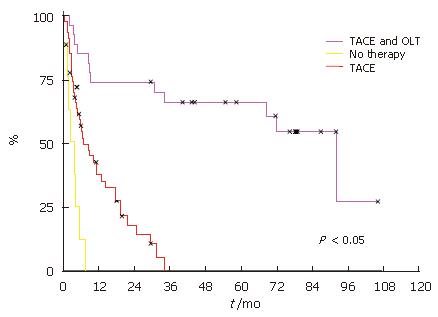
Figure 1 Survival probabilities for the first 5 yr after treatment.
Overall HCC patient survival who had received TACE and OLT, only TACE and patients who received no treatment.
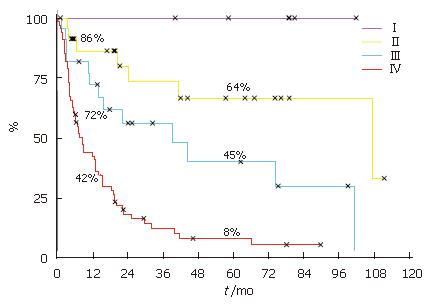
Figure 2 Kaplan-Meier patient survival curves showing survival dependent on UICC stage.
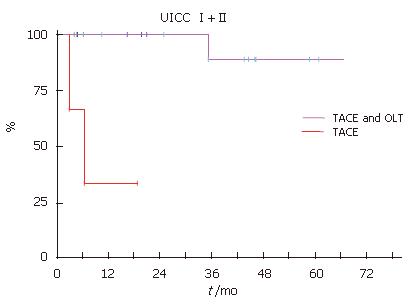
Figure 3 Kaplan-Meier patient survival curves demonstrating that OLT improved survival UICC stageIand II.
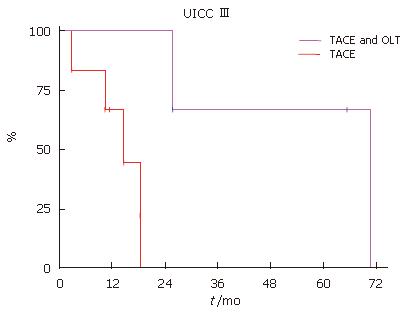
Figure 4 Kaplan-Meier patient survival curves.
OLT improved survival UICC stage III.
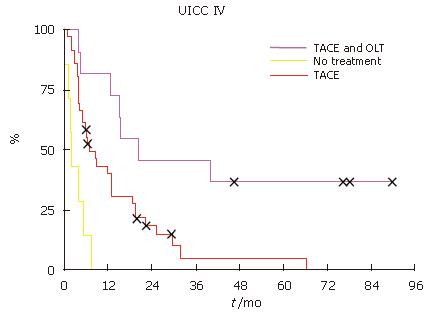
Figure 5 Kaplan-Meier patient survival curves.
OLT improved survival UICC stage IV.
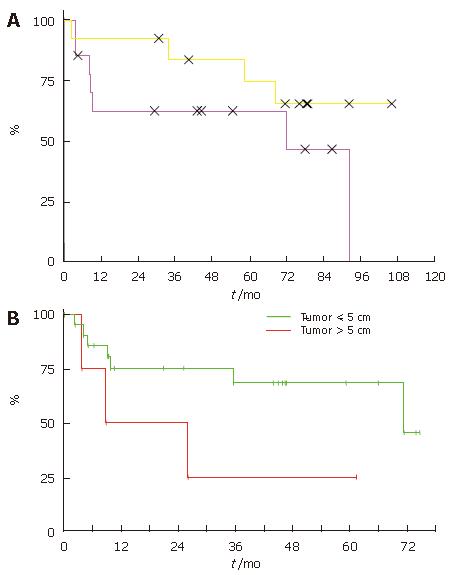
Figure 6 Survival probabilities for the first 5 years after liver transplantation according to the Milan criteria (A) and tumor size (B).
- Citation: Obed A, Beham A, Püllmann K, Becker H, Schlitt HJ, Lorf T. Patients without hepatocellular carcinoma progression after transarterial chemoembolization benefit from liver transplantation. World J Gastroenterol 2007; 13(5): 761-767
- URL: https://www.wjgnet.com/1007-9327/full/v13/i5/761.htm
- DOI: https://dx.doi.org/10.3748/wjg.v13.i5.761


