Copyright
©2007 Baishideng Publishing Group Co.
World J Gastroenterol. Feb 7, 2007; 13(5): 676-682
Published online Feb 7, 2007. doi: 10.3748/wjg.v13.i5.676
Published online Feb 7, 2007. doi: 10.3748/wjg.v13.i5.676
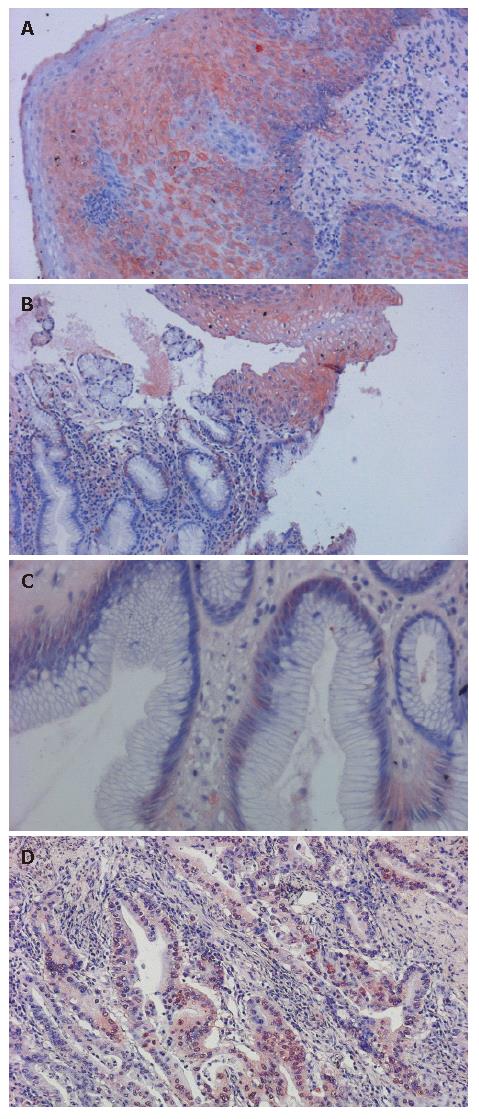
Figure 1 Expression of GST in different esophageal tissues.
A: GST strong positive staining was observed in the normal esophagus (200 ×); B: Normal esophageal epithelium (top) with Barrett’s metaplasia (bottom) (200 ×); C: Normal esophageal epithelium shows strong positive immunostaining compared to the weaker GST expression in Barrett’s metaplasia (400 ×); D: Adenocarcinoma showing almost no expression of GST (200 ×); GST was mainly expressed within the cytoplasm.
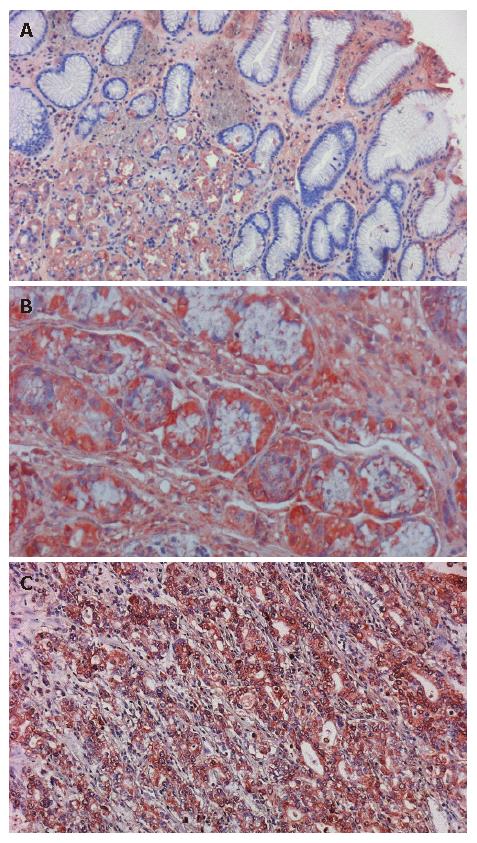
Figure 2 Expression of MMP-9 in different esophageal tissues.
Strong positive immunostaining of MMP-9 in (A) Barrett’s metaplasia (400 ×), (B) dysplasia (400 ×) and (C) adenocarcinoma (200 ×) of the esophagus. Cytoplasm of the metaplastic and dysplastic cells and cytoplasmic membranes of the esophageal adenocarcinoma cells were stained brown. Barrett’s metaplasia with concomitant dysplasia and adenocarcinoma show the most intensive expression of MMP-9.
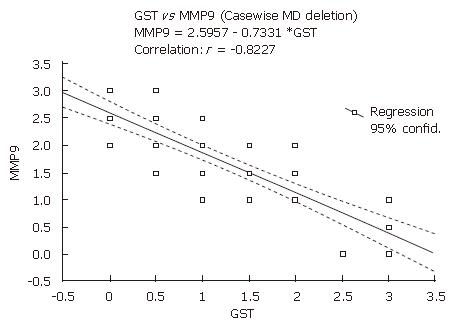
Figure 3 The correlation between immunohistochemical expressions of GST and MMP9 in different esophageal tissues.
Immunohistochemical expressions of GST and MMP9 were inversely correlated (r = - 0.82; P = 0.001).
- Citation: Herszenyi L, Hritz I, Pregun I, Sipos F, Juhasz M, Molnar B, Tulassay Z. Alterations of glutathione S-transferase and matrix metalloproteinase-9 expressions are early events in esophageal carcinogenesis. World J Gastroenterol 2007; 13(5): 676-682
- URL: https://www.wjgnet.com/1007-9327/full/v13/i5/676.htm
- DOI: https://dx.doi.org/10.3748/wjg.v13.i5.676


