Copyright
©2007 Baishideng Publishing Group Co.
World J Gastroenterol. Dec 28, 2007; 13(48): 6498-6505
Published online Dec 28, 2007. doi: 10.3748/wjg.v13.i48.6498
Published online Dec 28, 2007. doi: 10.3748/wjg.v13.i48.6498
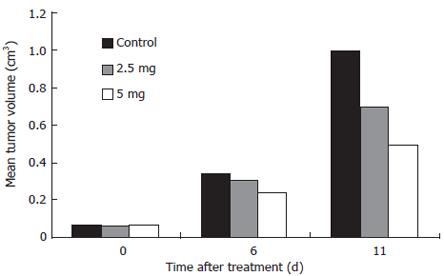
Figure 1 Arsenic trioxide inhibition gastric tumor xenografts growth.
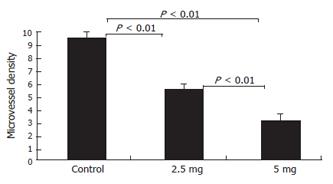
Figure 2 Effect of arsenic trioxide on tumor angiogenesis.
Microvessel density (MVD) was measured with counting the fluorescence staining cell in high power field (400). Data are given as mean and SE.
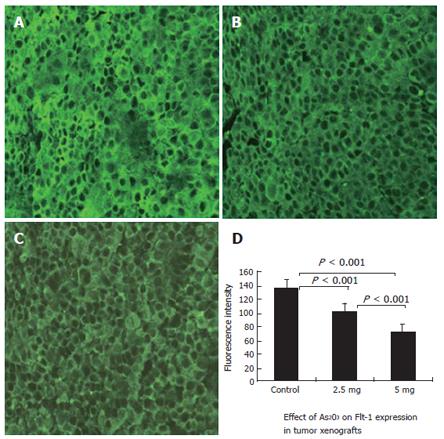
Figure 3 Effective inhibition of expression of Flt-1 (VEGFR-1) in the xenograft tumors by treatment with arsenic trioxide.
Flt-1 expression was determined by Immunofluorescence staining and laser confocal microscope. Original magnification × 400. A: Control group; B: 2.5 mg/kg group; C: 5 mg/kg group; D: Quantitative analysis of fluorescence intensity in the three groups of tumors was measured using the Leica Confocal analysis system. Data are given as mean and SE.
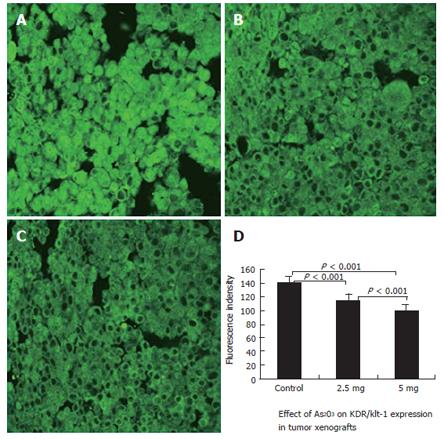
Figure 4 Effective inhibition of expression of KDR (VEGFR-2) in the xenograft tumors by treatment with arsenic trioxide.
KDR expression was determined by Immunofluorescence staining and laser confocal microscopy. Original magnification × 400. A: Control group; B: 2.5 mg/kg group; C: 5 mg/kg group; D: Quantitative analysis of fluorescence intensity in the three groups of tumors was measured using the Leica Confocal analysis system. Data are given as mean and SE.
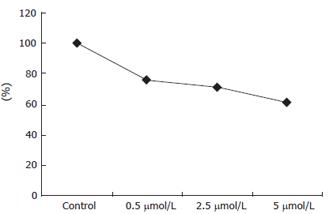
Figure 5 Effect of As2O3 on growth of ECV304 cells.
The cell viability was analyzed by MTT assay.
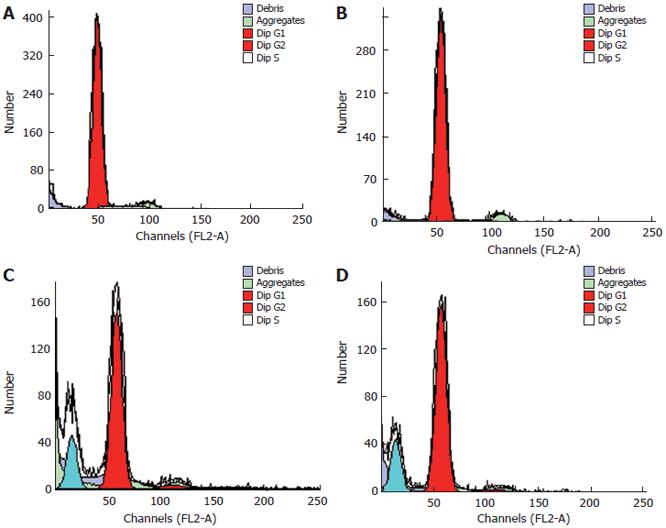
Figure 6 Effect of As2O3 on cell cycle of ECV304 cells.
A: Control; B: 0.5 μmol/L As2O3; C: 2.5 μmol/L As2O3; D: 5 μmol/L As2O3.
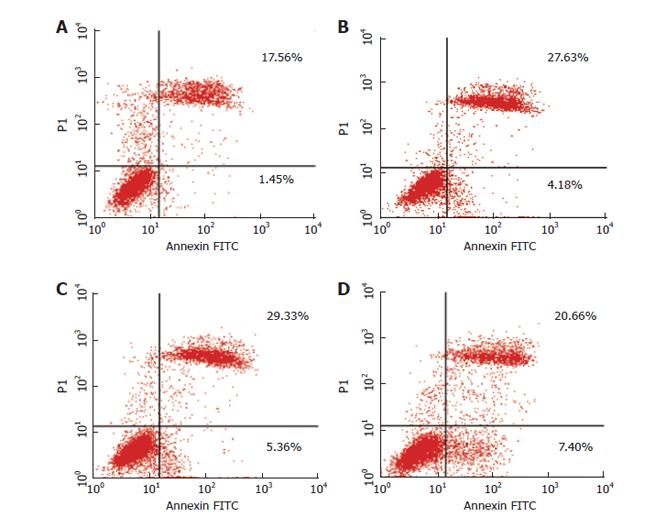
Figure 7 Induction of apoptosis in ECV304 with As2O3.
Dual-stained with Annexin-V-FITC and PI and analyzed by flow cytometry. There was a dose-dependent increase in early apoptotic cells, as shown in the fourth quadrants plots. A: Control; B: 0.5 μmol/L As2O3; C: 2.5 μmol/L As2O3; D: 5 μmol/L As2O3.
- Citation: Xiao YF, Wu DD, Liu SX, Chen X, Ren LF. Effect of arsenic trioxide on vascular endothelial cell proliferation and expression of vascular endothelial growth factor receptors Flt-1 and KDR in gastric cancer in nude mice. World J Gastroenterol 2007; 13(48): 6498-6505
- URL: https://www.wjgnet.com/1007-9327/full/v13/i48/6498.htm
- DOI: https://dx.doi.org/10.3748/wjg.v13.i48.6498


