Copyright
©2007 Baishideng Publishing Group Co.
World J Gastroenterol. Dec 28, 2007; 13(48): 6470-6477
Published online Dec 28, 2007. doi: 10.3748/wjg.v13.i48.6470
Published online Dec 28, 2007. doi: 10.3748/wjg.v13.i48.6470
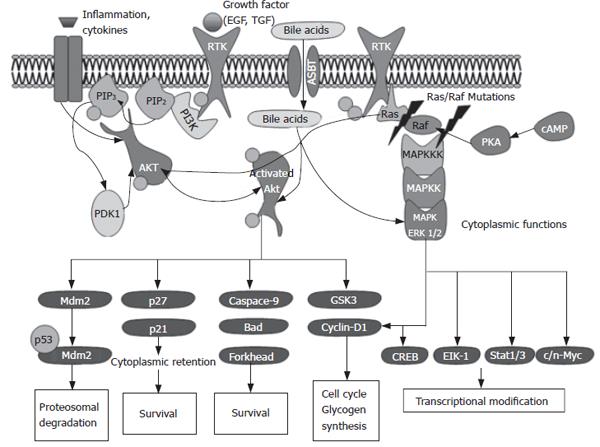
Figure 1 Overview of the AKT and ERK signaling pathway.
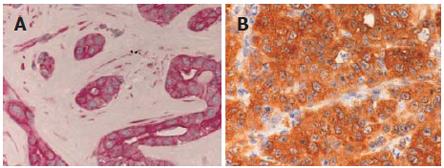
Figure 2 Light micrograph displaying strong phospho-ERK1/2 (A) and strong phospho-AKT (B) expression as analyzed by immunohistochemistry in intrahepatic cholangiocarcinoma (x 400).
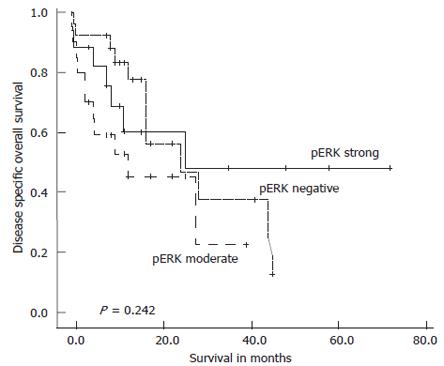
Figure 3 Kaplan-Meier survival plot for disease specific overall survival in the complete series of 62 intrahepatic cholangiocarcinoma in relation to pERK immunostaining intensity.
Log-rank test: P = 0.242.
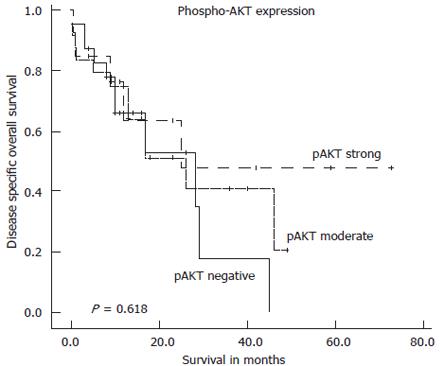
Figure 4 Kaplan-Meier survival plot for disease specific overall survival in the complete series of 59 intrahepatic cholangiocarcinoma in relation to pAKT immunostaining intensity.
Log-rank test: P = 0.618.
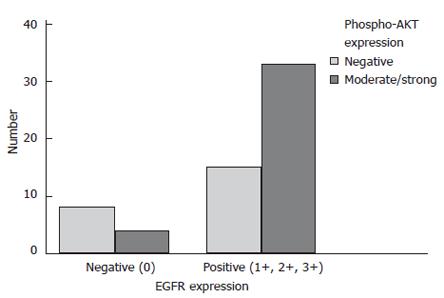
Figure 5 Intrahepatic cholangiocarcinoma with positive EGFR expression exhibit significantly more frequent AKT activation (χ2 analysis: P = 0.
028).
- Citation: Schmitz K, Lang H, Wohlschlaeger J, Sotiropoulos G, Reis H, Schmid K, Baba H. AKT and ERK1/2 signaling in intrahepatic cholangiocarcinoma. World J Gastroenterol 2007; 13(48): 6470-6477
- URL: https://www.wjgnet.com/1007-9327/full/v13/i48/6470.htm
- DOI: https://dx.doi.org/10.3748/wjg.v13.i48.6470


