Copyright
©2007 Baishideng Publishing Group Inc.
World J Gastroenterol. Dec 21, 2007; 13(47): 6385-6395
Published online Dec 21, 2007. doi: 10.3748/wjg.v13.i47.6385
Published online Dec 21, 2007. doi: 10.3748/wjg.v13.i47.6385
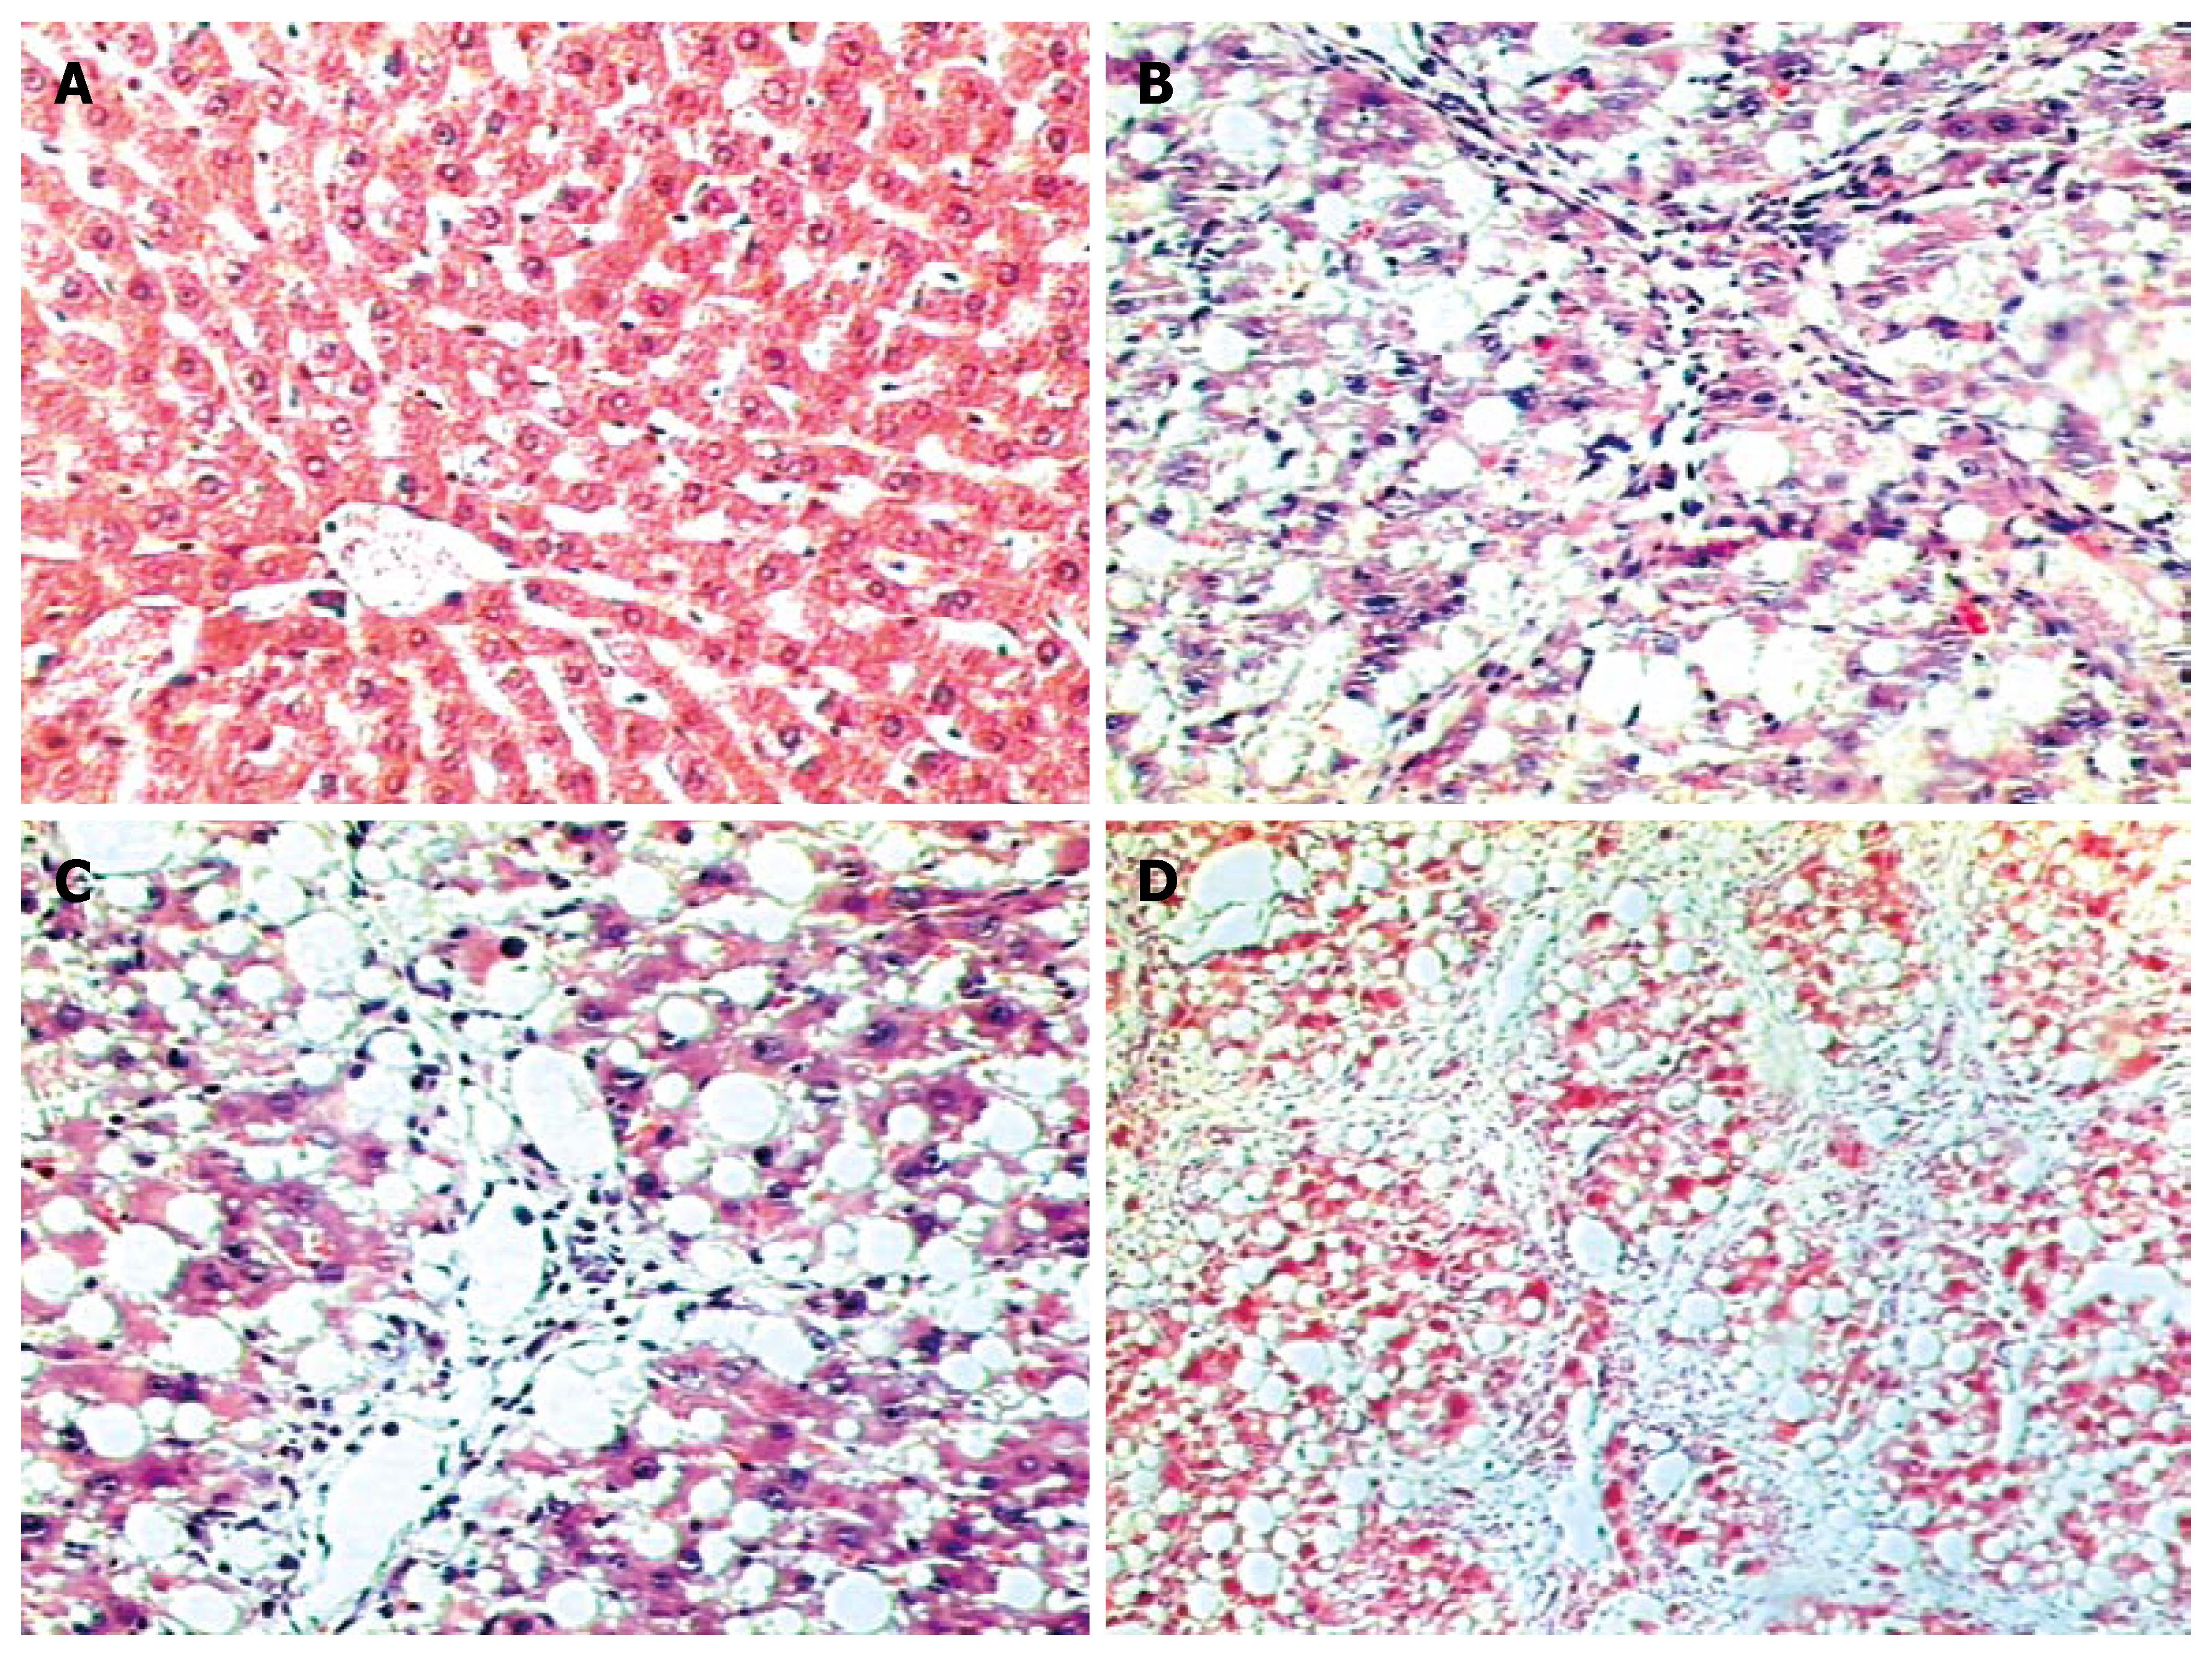
Figure 1 Liver histology of HPS (HE, × 100) in normal control group (A), 4th wk group (B), 6th wk group (C) and 8th wk group (D).
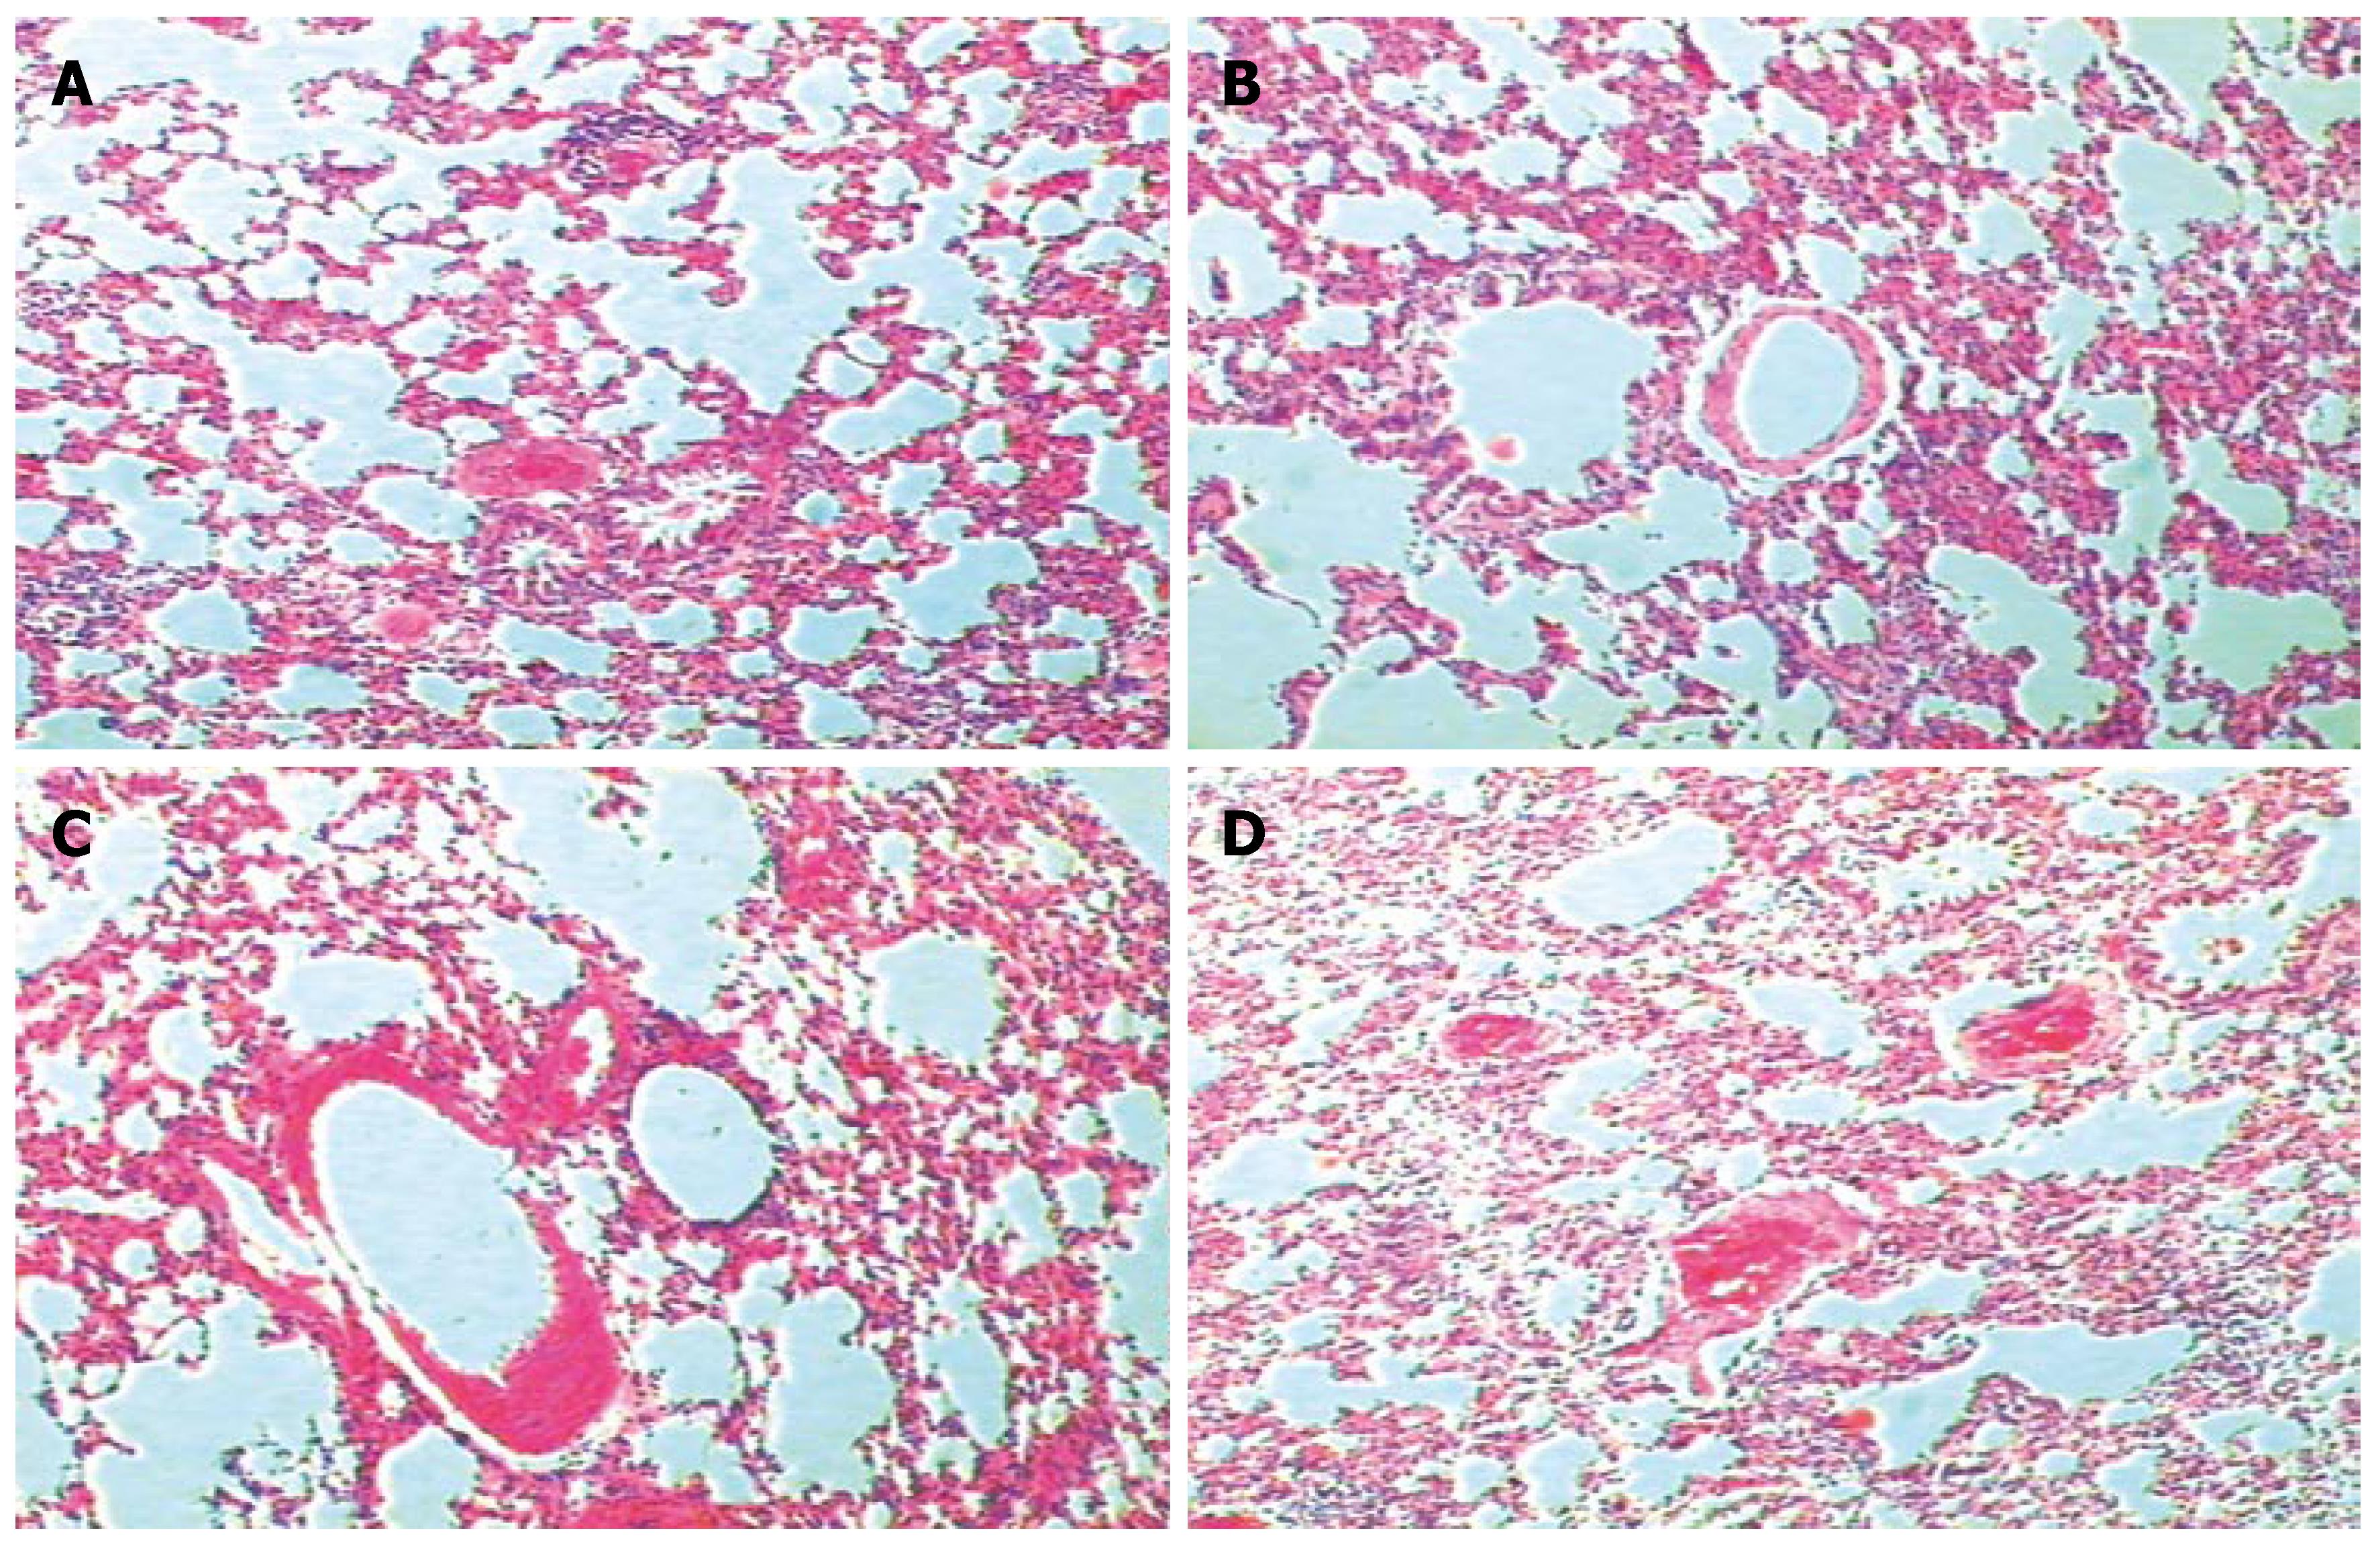
Figure 2 Lung histology of HPS (HE, × 200) in normal control group (A), 4th wk group (B), 6th wk group (C) and 8th wk group (D).
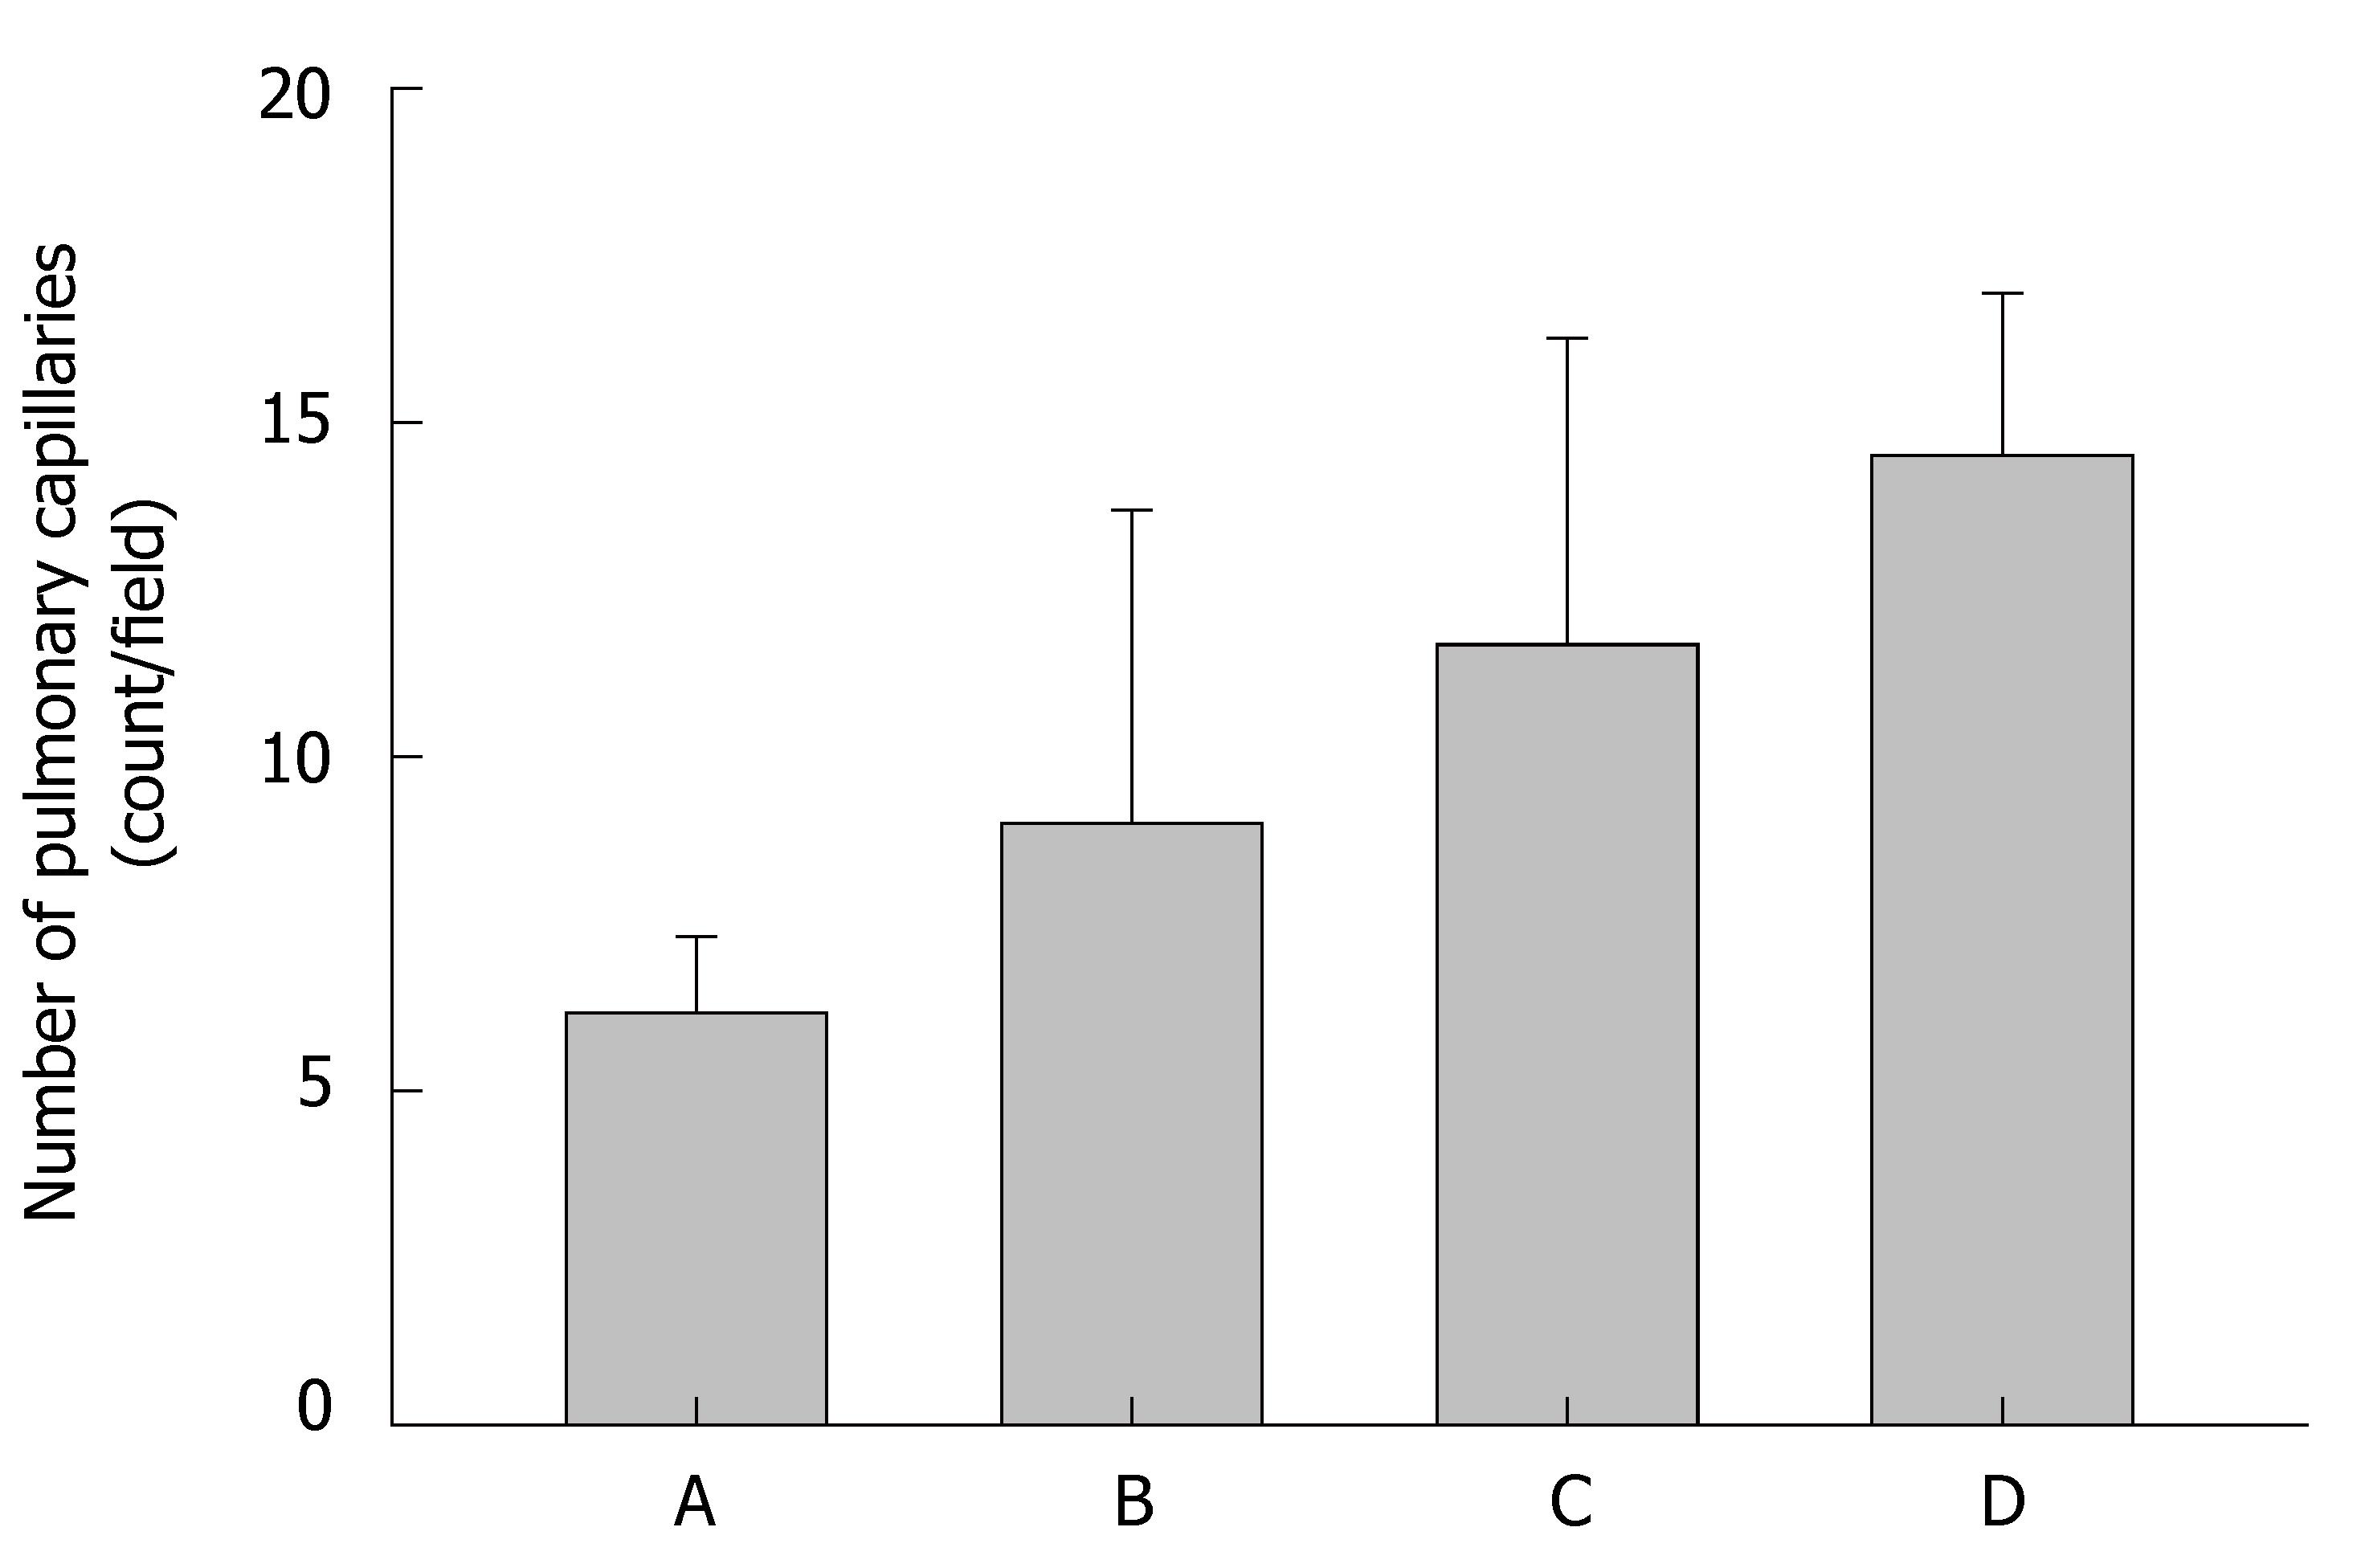
Figure 3 Change in the number of pulmonary capillaries in normal control group (A), 4th wk group (B), 6th wk group (C) and 8th wk group (D).
aP < 0.05 B, C, D vs A; aP < 0.05 D vs B.
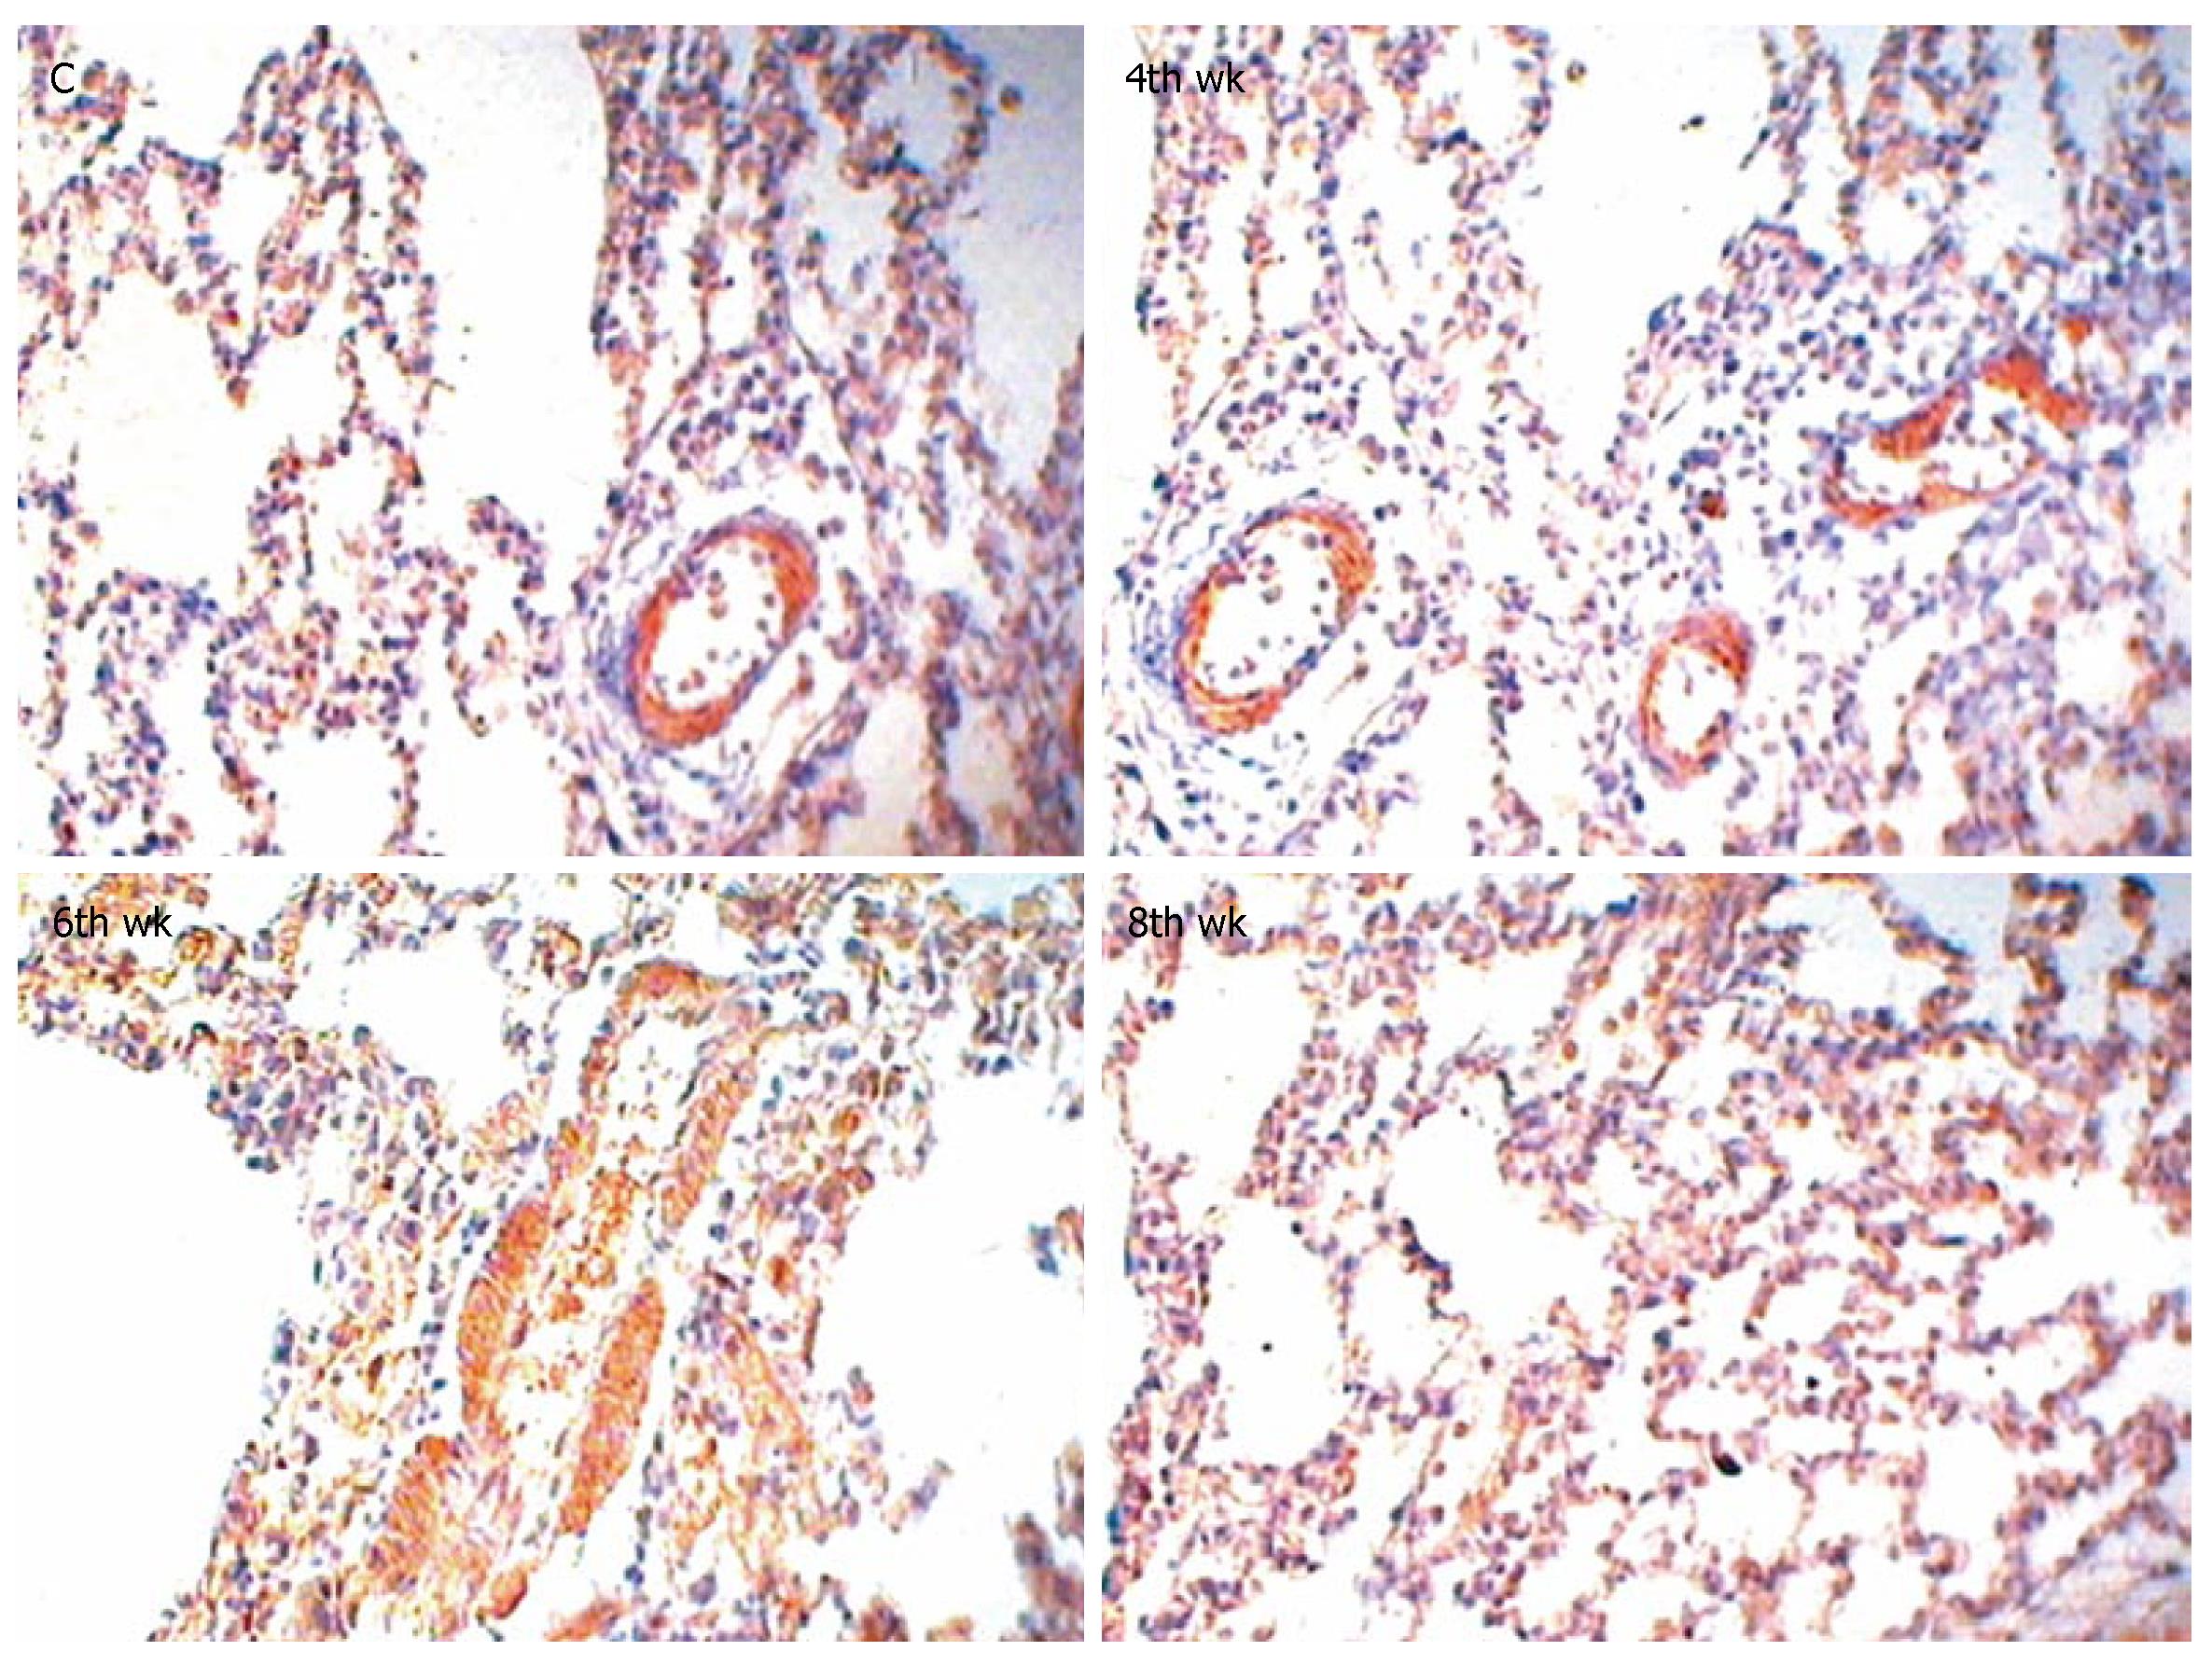
Figure 4 Immunohistochemistry of NOS expressions in the lung of rats with their eNOS and iNOS stained brown (× 200).
Figure 5 Expre-ssion of eNOS mRNA (A) and iNOS mRNA (B) in rat lung.
M: DNA size marker; 1: control; 2: 4th wk group; 3: 6th wk group; 4: 8th wk group.
Figure 6 Immunohistochemistry of HO-1 expressions in lung of rats with HO-1 stained brown (× 200).
- Citation: Zhang HY, Han DW, Su AR, Zhang LT, Zhao ZF, Ji JQ, Li BH, Ji C. Intestinal endotoxemia plays a central role in development of hepatopulmonary syndrome in a cirrhotic rat model induced by multiple pathogenic factors. World J Gastroenterol 2007; 13(47): 6385-6395
- URL: https://www.wjgnet.com/1007-9327/full/v13/i47/6385.htm
- DOI: https://dx.doi.org/10.3748/wjg.v13.i47.6385


