Copyright
©2007 Baishideng Publishing Group Inc.
World J Gastroenterol. Dec 14, 2007; 13(46): 6203-6207
Published online Dec 14, 2007. doi: 10.3748/wjg.v13.i46.6203
Published online Dec 14, 2007. doi: 10.3748/wjg.v13.i46.6203
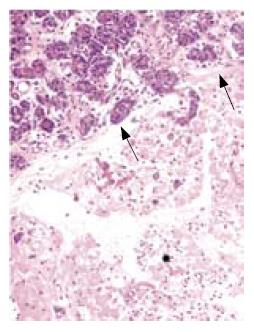
Figure 1 Light microscopy showing extensive necrosis (star) and relatively normal acinar structure (arrows) between the necrotic areas in the control group (HE, × 200).
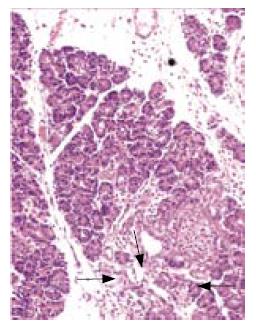
Figure 2 Light microscopy showing interlobular edema (star) and necrotic area (arrows) in the combined treatment group (HE, × 200).
- Citation: Comert B, Isik AT, Aydin S, Bozoglu E, Unal B, Deveci S, Mas N, Cinar E, Mas MR. Combination of allopurinol and hyperbaric oxygen therapy: A new treatment in experimental acute necrotizing pancreatitis? World J Gastroenterol 2007; 13(46): 6203-6207
- URL: https://www.wjgnet.com/1007-9327/full/v13/i46/6203.htm
- DOI: https://dx.doi.org/10.3748/wjg.v13.i46.6203


